Introduction
Muscle biopsy plays an integral role in
evaluation of the patient with neuromuscular
disease. With occasional exceptions, it is
an essential element in the assessment of a
patient with suspected myopathy. In addition
to being indispensable for the evaluation of
muscle diseases, muscle biopsy is also
involved in the evaluation of suspected
neuropathic disease, particularly in the
distinction of an atypical neurogenic
disorder from a primary myopathic one, and
for diagnosis of a variety of systemic
disorders.
The surgical procedure to obtain a muscle
biopsy is relatively simple and poses little
risk to the patient, but it is a specialized
procedure and must be performed properly to
optimize the information it can yield for
the benefit of the patient.
The clinician must first arrive at a
rational differential diagnosis by
synthesizing information obtained from the
clinical history, physical examination, and
laboratory and electrodiagnostic studies.
This information is used to influence the
details of each procedure. The choices of
the right time for biopsy, which muscle to
select, how many specimens to obtain, and
how to handle them immediately following
excision are individualized for each patient
on the basis of clinical findings.
After the biopsy arrives in the pathology
laboratory, it undergoes a complex series of
studies. The pathologist uses knowledge of
the clinical features to assist in
interpretation of the constellation of
pathologic findings in the biopsy and to
help determine whether additional studies
are warranted for a given patient.
Therefore, muscle biopsy is somewhat
complex in that an optimal outcome requires
coordination of the clinician, surgical
team, pathologist, and technical staff in
the pathology laboratory. As muscle biopsy
results are often interpreted at specialized
centers, a courier service also may need to
be involved in the process; this is yet one
more link in the chain from procedure to
diagnosis.
Every muscle pathologist has a series of
stories about biopsy procedures that were
performed improperly. Many of these
situations were salvaged and yielded
diagnoses, but on occasion, the specimen was
inadequate for the diagnosis under
consideration or some aspect of the
procedure was performed so improperly that
the procedure had to be repeated.
Occasional situations exist when the
biopsy must be repeated for precise
diagnosis and no one is at fault. Some
situations in which this may occur include
the following:
- A normal biopsy result without
pathologic findings in the setting of a
high level of clinical suspicion of a
disorder with a patchy distribution,
such as polymyositis
- An atypical presentation of a rare
metabolic disorder, which would not
ordinarily be suspected before biopsy
Unsuitable, suboptimal, or inadequate
biopsy specimens usually can be attributed
to lack of planning and forethought; no
excuse exists for this situation. The single
most important point to remember when one
contemplates muscle biopsy (also the single
most important point of this article) is to
call the pathology laboratory in advance for
advice on how to proceed.
Indications for Muscle Biopsy
When a clinical diagnosis of myopathy is
considered, muscle biopsy is required (with
occasional exceptions).
Muscle biopsy is an integral part of the
initial evaluation of a patient with
possible muscle disease, or myopathy. At
present, muscle biopsy is absolutely
essential part of the diagnostic
investigation of most categories of muscle
diseases, including inflammatory and many
metabolic and congenital myopathies, as well
as most of the muscular dystrophies.
Today, the most specific and definitive
effective therapies are for inflammatory
myopathies. Performing muscle biopsy to
diagnose these disorders before the start of
therapy is of critical importance for
several reasons:
- The risk of treatment, including
steroids, immunosuppressive agents, and,
in some cases, intravenous
immunoglobulin, is high enough that the
diagnosis should be confirmed before
therapy is started.
- A delay often occurs between the
start of therapy and a clinical
response. To persevere in the absence of
a prompt clinical response, confidence
in the diagnosis before therapy is
beneficial.
- Treatment can alter the
histopathologic findings. If treatment
is started and then biopsy is done
because of a lack of clinical response
to the therapy, the pathologic findings
can be difficult or impossible to
interpret because the intervention may
have altered them.
Repeat muscle biopsy is occasionally
indicated to evaluate the patient with known
inflammatory myopathy who, after improvement
with steroid therapy, has increasing
weakness. Biopsy findings can help
distinguish between exacerbation of the
disorder and steroid myopathy.
For other disorders with therapeutic
options less definitive than those for
inflammatory myopathies, several reasons
underlie the importance of obtaining a
precise diagnosis:
- Palliative therapies are indicated
for some patients.
- Some patients' disorders are
eligible for therapeutic clinical
trials.
- Many conditions are hereditary
diseases, and diagnosis is required for
proper genetic counseling.
- Patients may benefit from prognostic
information.
One common indication for muscle biopsy
is to distinguish between myopathy and
neuropathy. Their classic presentations are
clearly distinct; however, in practice,
their histories and physical and laboratory
findings often overlap. Neuropathy and
myopathy may also coexist, making a
diagnosis based on clinical findings alone
even more difficult than it already is.
When a Muscle Biopsy is Not Indicated
The only exceptions to the requirement
for muscle biopsy for accurate diagnosis of
possible myopathy are suspected
dystrophinopathies (also known as Duchenne
or Becker muscular dystrophies), some rare
congenital and limb-girdle dystrophies
(Vogel, 2005), myotonic dystrophy, certain
mitochondrial disorders, periodic paralyses,
and endocrine myopathies.
Dystrophinopathies and certain other
muscular dystrophies
Recent advances in molecular genetics
have eliminated the need for muscle biopsy
in some patients with dystrophinopathies. In
these patients, mutations, most commonly
deletions, can be demonstrated in the gene
for dystrophin, a structural protein of
skeletal muscle located on the X chromosome.
The gene for this protein is extremely large
(2 million base pairs); this size usually
precludes searching the entire gene for
point mutations. Muscle biopsy is still
required for definitive diagnosis in
approximately 40% of patients with these
disorders in whom genetic testing based on
current methods is uninformative.
Genetic testing is available for
fascioscapulohumeral dystrophy and Perlecan
deficiency (Schwartz-Jampel syndrome).
Therefore, muscle biopsy, for which findings
are nonspecific, is generally not indicated
to diagnose these disorders.
Myotonic dystrophy
Myotonic dystrophy now can be diagnosed
definitively by means of genetic testing to
look for the characteristic increase in
triplet repeats in a gene for a protein
kinase. This method is far superior to
muscle biopsy for diagnosing myotonic
dystrophy because the findings on muscle
biopsy are not specifically diagnostic;
however, they may be generally helpful to
support this diagnosis and exclude other
disorders.
Periodic paralyses
Periodic paralyses, uncommon disorders
that result from mutations in a variety of
genes for muscle membrane ion channels, have
unique clinical, biochemical, and
electrodiagnostic features. They lack
diagnostic findings on muscle biopsy, though
dilatation of the T tubule system is found
in some patients with hypokalemic periodic
paralysis. Muscle biopsy can also
demonstrate a nonspecific myopathic picture
in these disorders. Typically vacuoles are
seen on the biopsy sample.
Endocrine myopathies
Myopathy can be a feature of disorders of
thyroid, parathyroid, and adrenal function.
The correct way to diagnose endocrine
myopathies is to recognize their clinical
presentations and follow this with serologic
testing for appropriate components of the
hypothalamic-pituitary–endocrine organ axis.
Myotonic dystrophy, periodic paralyses,
and endocrine myopathies are not considered
further in this article.
Clinical and Laboratory Features of
Neuromuscular Disease
Clinical features
Few findings in a muscle biopsy are
pathognomonic for a specific diagnosis.
Instead, a typical muscle biopsy sample
presents a constellation of findings that
must be interpreted in light of the clinical
history. Therefore, the pathologist must
know the clinical features of a given
patient to properly assess the clinically
significance of the histologic findings in a
muscle biopsy sample and to decide whether
to pursue additional special studies.
The clinical hallmark of neuromuscular
disease, whether of neurogenic or myopathic
origin, is weakness. Weakness is manifested
in age-related variations. For example, in
utero weakness may be expressed as decreased
fetal movements and may be recognized by a
woman who has had previous pregnancies. In
the neonatal period, the infant may be
floppy. In later infancy and during the
toddler years, delay in an acquisition of
motor-developmental milestones is likely the
major sign of weakness. From childhood
through adulthood, diminished muscle power
is a characteristic clinical feature of
neuromuscular disease.
The classical clinical features of
myopathy include the following:
- Weakness, which predominantly
affects the proximal muscle groups (eg,
shoulder and limb girdles)
- Myalgia, or muscle aching, which is
present in some patients with
inflammatory myopathy (Muscle pain is
also found in some patients with
metabolic diseases affecting muscle and
occurs when the energy supply of the
muscle is depleted and lactic acid
builds up.)
- Preservation of muscle-stretch
reflexes
- Absence of abnormalities of
somatosensation
Variation of strength with exercise can
occur in some patients with muscle disease.
This can mean either decremental or
incremental change in strength with activity
that would not result in this change in a
healthy individual.
- Fluctuation of muscle power can
suggest a metabolic myopathy. For
example, in McArdle disease, a
deficiency of myophosphorylase causes an
inability to mobilize glycogen. A
patient with this disorder has pain and
weakness during the anaerobic phase of
exercise. If the patient can exercise at
a low level during the anaerobic phase
to avoid drawing on glycogen stores,
when the aerobic phase of exercise is
finally reached and glycogenolysis no
longer is needed, the patient's
performance improves.
- Fatigability is a term that denotes
progressive loss of muscle power with
exertion that improves with rest. This
is a defining clinical feature of
myasthenia gravis, a disorder of
impaired neuromuscular transmission.
Muscle biopsy is typically not performed
for myasthenia gravis.
In contrast to myopathy, the classic
clinical features of peripheral neuropathy
include the following:
- Weakness predominantly affecting
distal musculature
- Decrease of muscle-stretch reflexes,
particularly in demyelinating
neuropathies
- Fasciculations, when abnormal
excitability of the motor neuron is
present
- Somatosensory abnormalities
In their conventional clinical
presentations, distinguishing muscle disease
from peripheral nerve disease is a
straightforward matter. In practice, this is
not always simple. Several reasons explain
why it may be difficult to determine whether
a patient has neuropathy or myopathy on
clinical evaluation:
- Some myopathies affect distal
muscles. Myotonic dystrophy,
inclusion-body myositis (IBM), and
distal myopathy of Welander are examples
of myopathies that may affect distal
muscle groups.
- Some neurogenic disorders, including
diabetic amyotrophy and motor neuron
disease, may affect proximal muscles.
- Some patients may have combined
neurogenic and myopathic disorders. For
example, a patient with neuropathy
related to diabetes mellitus may develop
an inflammatory myopathy. A patient who
has peripheral neuropathy caused by
chemotherapy for cancer may develop
dermatomyositis. A patient may have
radiculopathy caused by degenerative
joint disease in the vertebral column
and a primary myopathy. In these
examples, the clinical findings are
complicated and may lead to diagnostic
confusion.
Laboratory studies
The serum creatine kinase (CK) level is
the single most important blood value to
obtain when myopathy is being considered. A
representative reference range is 24-196
IU/L. The CK level is useful, but not
definitive, in determining whether
neuropathy or myopathy is present. Extremely
elevated levels of CK (>1000 IU/L) almost
always indicate muscle disease. Mildly
elevated levels (200-600 IU/L) can be
observed in either entity, and normal levels
are less likely to be found in the patient
with myopathy. Patients with myopathy and
severely reduced residual muscle mass may
have a normal serum CK level.
The serum aldolase level may be helpful
in further suggesting myopathy. Because of
its longer half-life in serum, the serum
aldolase level may be elevated in the
setting of myopathy when the CK level is
normal.
Electrodiagnostic studies
Electrodiagnostic studies are often
extremely useful in determining whether a
neuropathic, myopathic, or mixed disorder is
present.
Changes in nerve conduction velocities
and the compound muscle-action potential can
be present in neurogenic disorders.
Electromyography (EMG) shows different
findings in neurogenic and myopathic
disorders and can be useful to help
distinguish them. Avoiding EMG in a muscle
that will undergo biopsy is of critical
importance. EMG inflicts damage on the
muscle that interferes with proper
interpretation of biopsy results for 1-2
months. In patients with suspected myopathy,
needle EMG should be performed on only 1
side.
Technical Considerations
The technical issues that must be
addressed by the physicians involved are the
proper selection of a muscle for biopsy, the
biopsy procedure and immediate handling of
the tissue in the operating room, and
studies performed on the biopsy sample.
Selection of a muscle for biopsy
Biopsy of a clinically involved muscle is
important. Some disease processes have a
patchy, rather than a diffuse, distribution.
To increase the likelihood of sampling the
pathologic process, selecting a symptomatic
muscle is important. Select a muscle on the
basis of the expected distribution of the
leading clinical diagnosis. For example, if
the leading diagnostic consideration is
polymyositis, select a proximal muscle such
as the vastus lateralis of the quadriceps,
for biopsy.
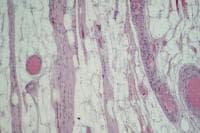
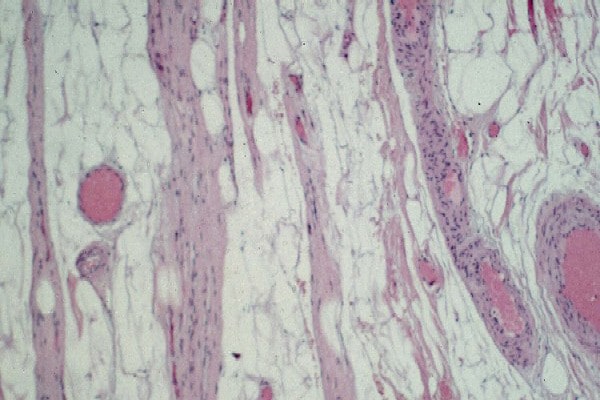
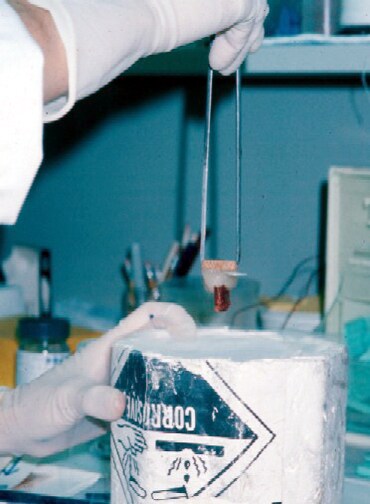
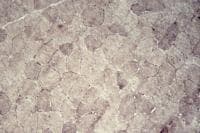
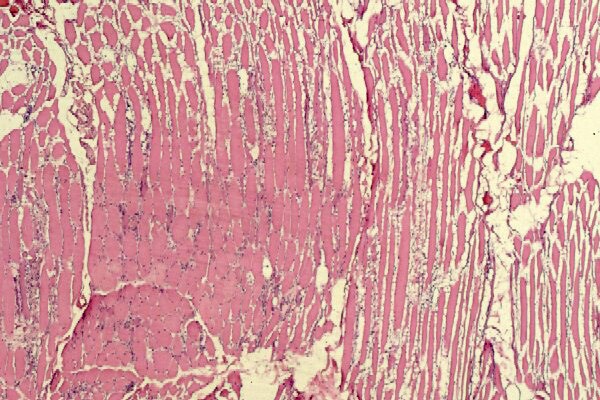
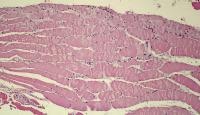
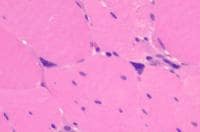
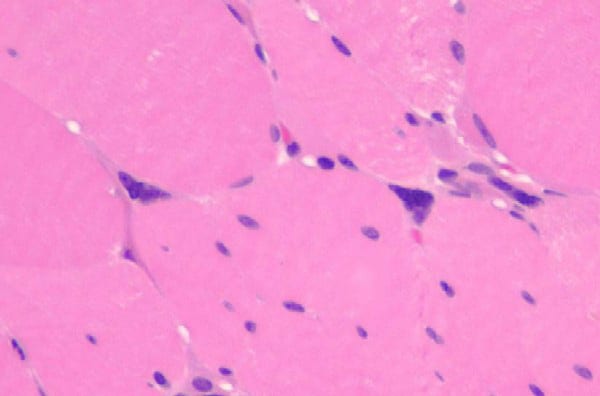
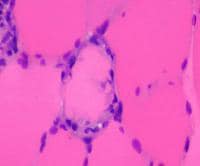
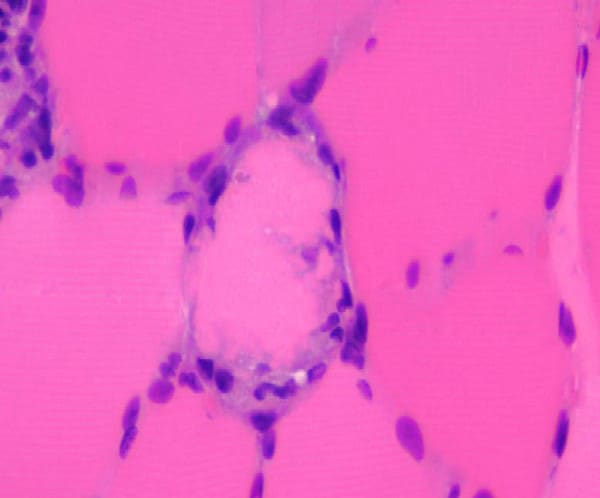
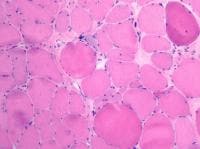
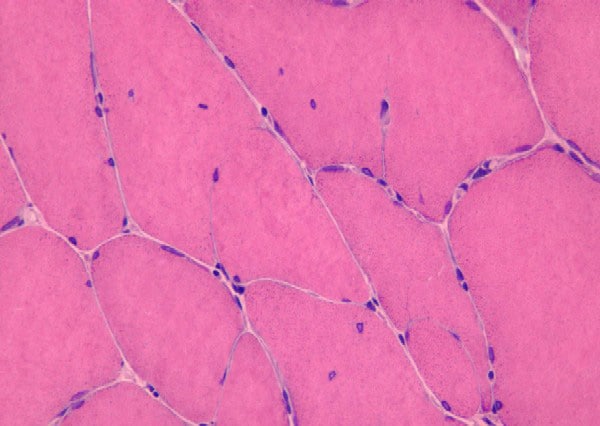
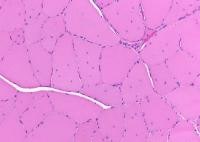
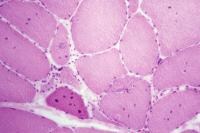
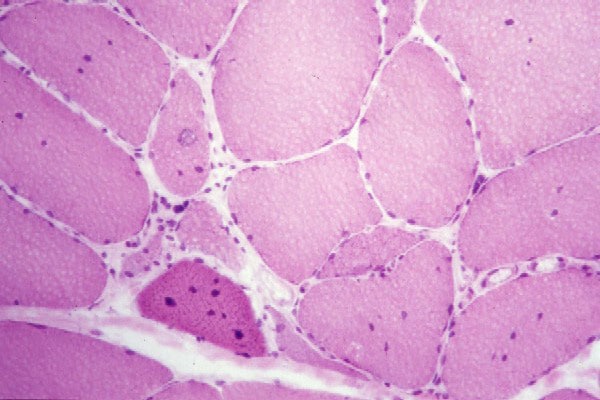
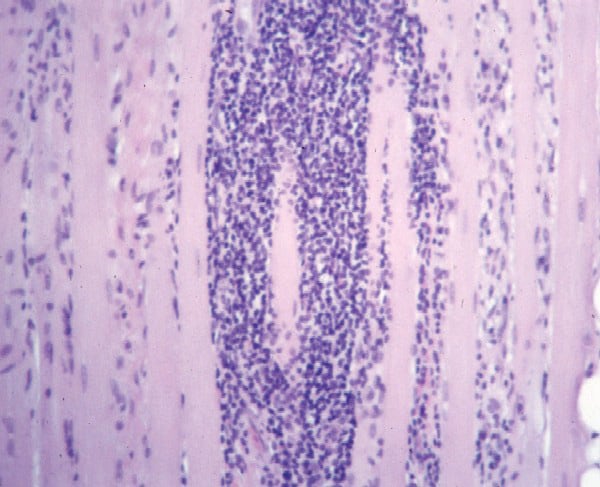
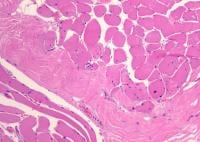
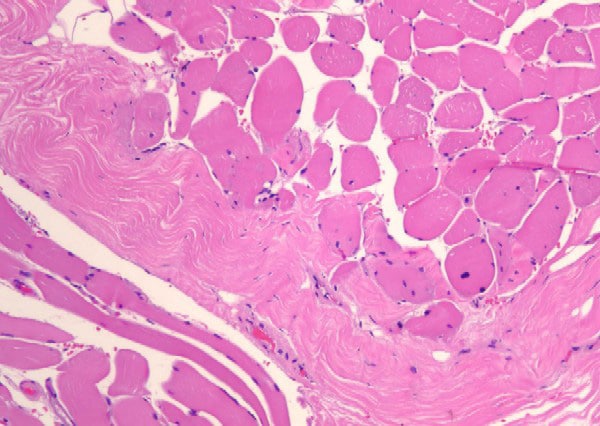
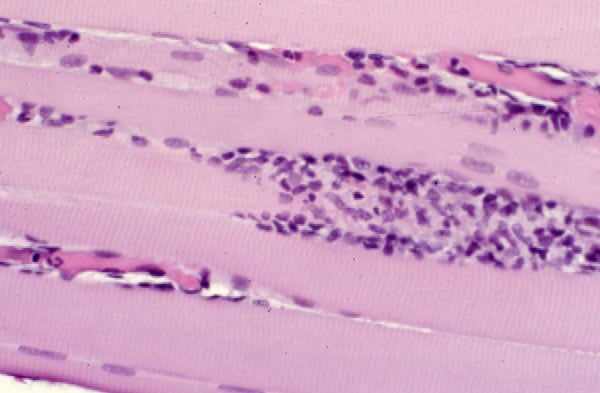
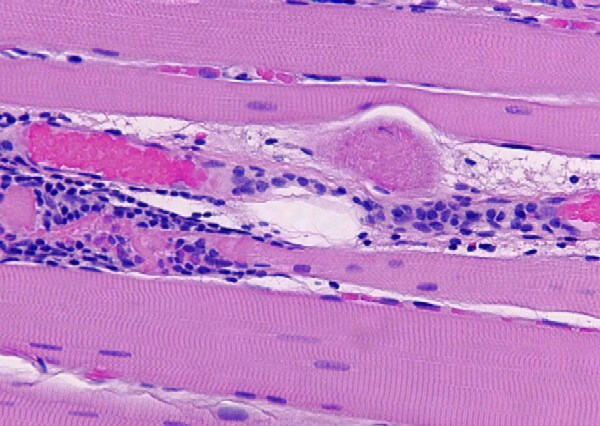
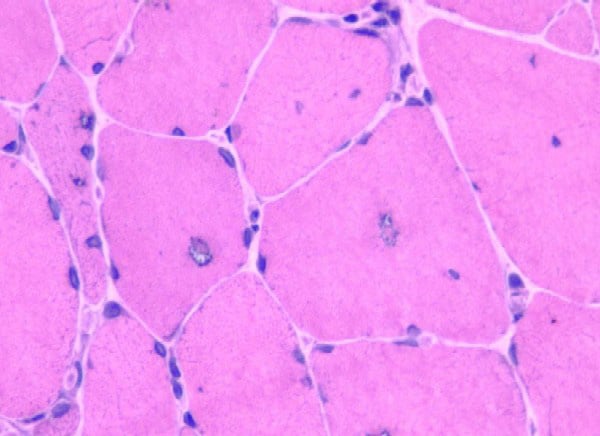
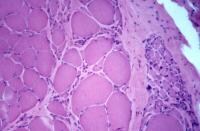
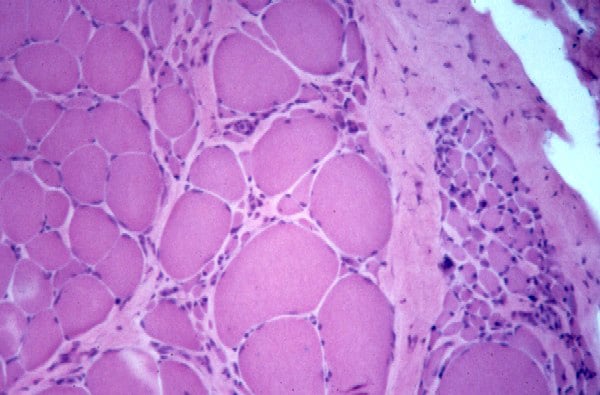
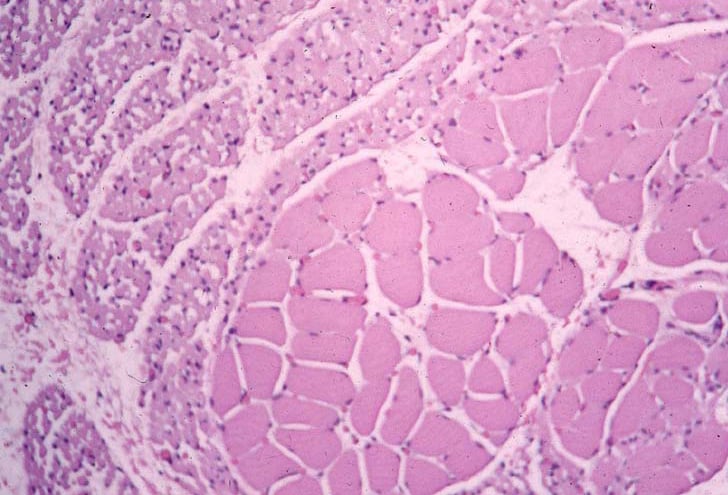
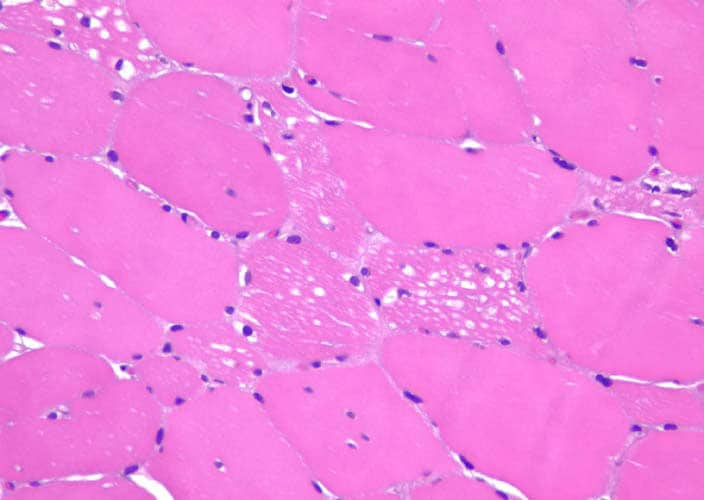
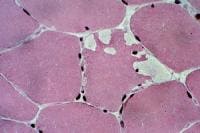
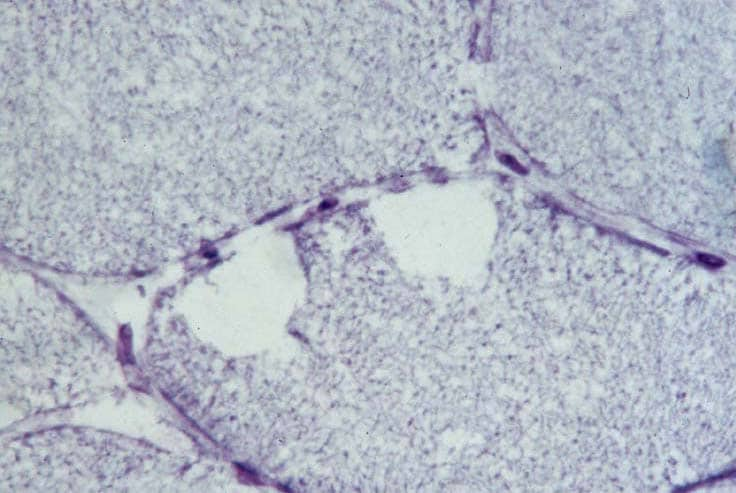
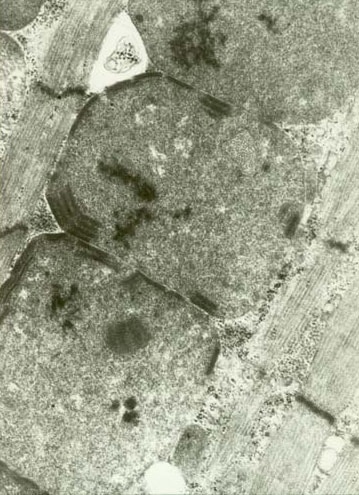
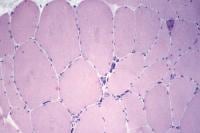
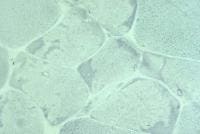
Biopsy a muscle that is not too weak and
atrophic (see
Media file 1). In this situation,
obtaining a sample of end-stage muscle is a
risk. In end-stage muscle, loss of myofibers
is severe, and they are replaced by
fibrovascular and adipose tissue, without
residual clues to the process that caused
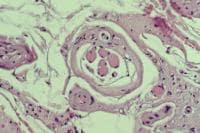
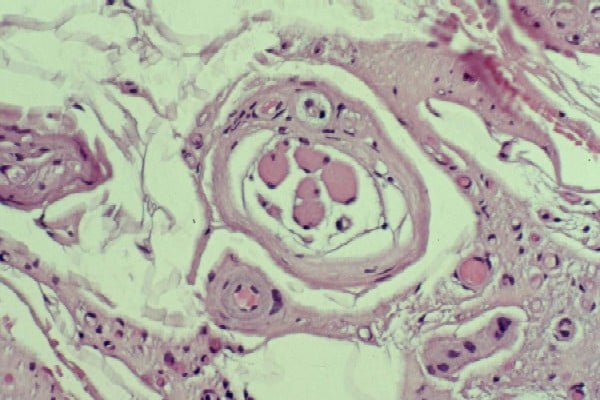
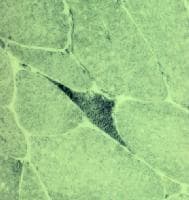
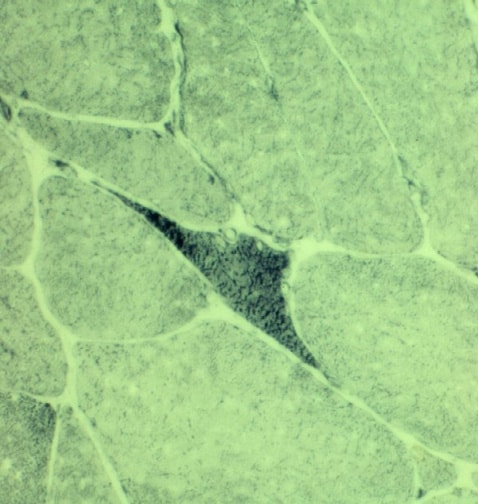
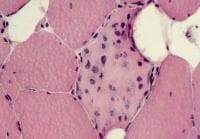
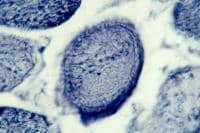
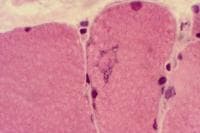
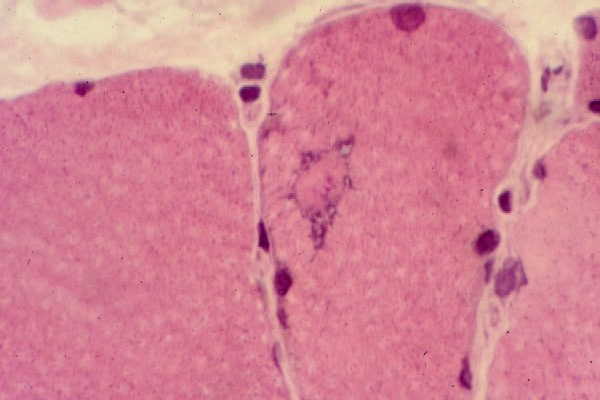
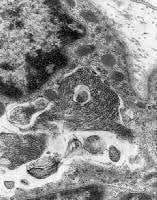
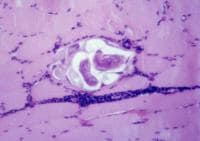
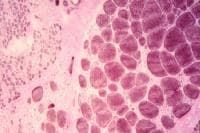
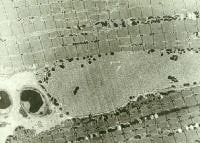
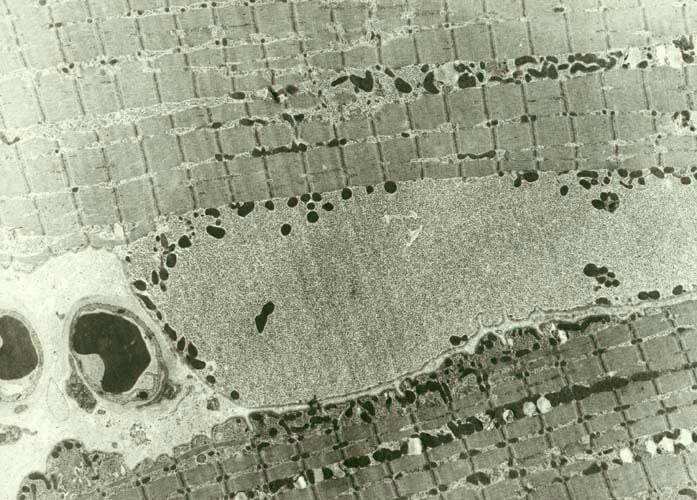
the muscle damage. On occasion, only the
presence of a muscle spindle confirms that
the specimen is a biopsy sample of skeletal
muscle (see
Media file 2).
Biopsy procedure and immediate handling
of tissue
The specimens required and the preferred
method of handling may vary among medical
centers. Consulting the center that will
receive the biopsy sample is essential to
learn exactly what is required and the
preferred method of handling and shipping
the tissue. However, the surgeon must
ultimately determine the precise surgical
method for each patient. Consider the
information below a general guide. These
considerations should be tailored to meet
the needs of the individual patient and
institution.
The typical muscle biopsy sample consists
of 2 specimens: fresh and fixed. In certain
special clinical circumstances, a third
sample is required for biochemical or
genetic analysis.
On occasion, a muscle biopsy sample
consists only of a single fresh specimen
obtained by means of needle biopsy. This
method provides a specimen of limited size.
However, this procedure may be the method of
choice, as follows:
- When serial biopsy procedures are
required to follow the course of the
disease or to monitor the response to
therapy in a patient
- When a disease with diffuse
distribution is being diagnosed so that
any sample of tissue is likely to be
pathologic
- When a sample of muscle is needed
for only biochemical study
- When open biopsy is contraindicated
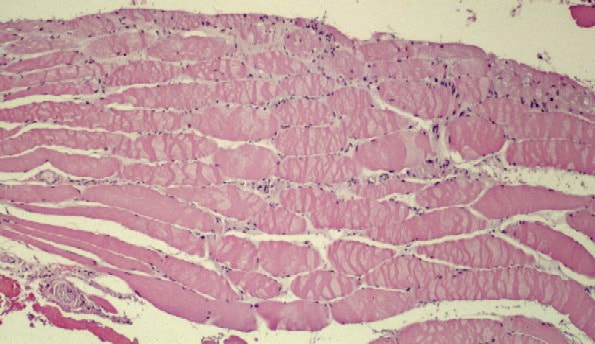
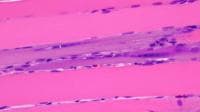
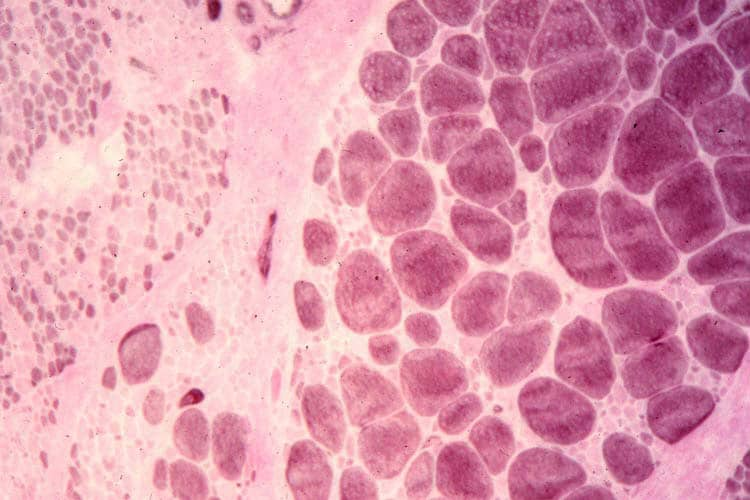
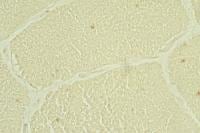
Fresh specimen
A fresh specimen (see
Media file 3) is used for histochemical
studies in all patients and for
immunofluorescence in selected patients,
when indicated. It should measure
approximately 0.5 X 0.5 cm in cross-section,
or 0.5 cm in diameter, and 1 cm in length
along the longitudinal axis of the muscle
fibers.
The sample can be sent to the laboratory
on saline-moistened gauze in a sealed
container on ice. This technique keeps the
specimen cold but does not cause it to
freeze. The tissue should not be immersed in
sodium chloride solution because this leads
to the formation of ice crystals in the
myofibers when the sample is frozen. When
the specimen arrives in the laboratory, the
technologist mounts it in gum tragacanth in
the appropriate orientation and snap freezes
it in isopentane chilled in liquid nitrogen.
Frozen cryostat sections are cut from this
sample.
In the optimal situation, this fresh
specimen is rapidly transported to the
laboratory for processing to prevent the
tissue from losing any of its enzymatic
reactivity or immunogenicity for
immunohistochemical studies. However, in
most situations, refrigeration of the
specimen is probably adequate for most
necessary studies after an overnight delay
or even a delay of a few days (though a
delay longer than overnight is definitely
not recommended).
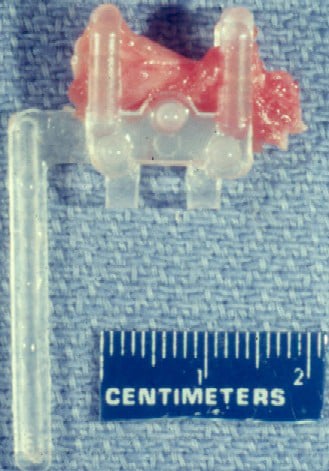
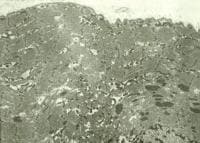
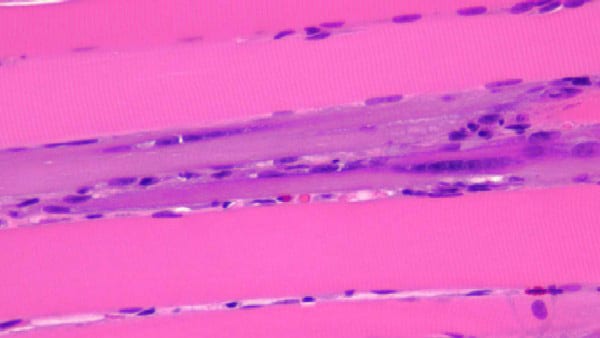
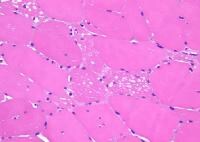
Fixed specimen
A fixed specimen (see
Media file 4) is used for routine
microscopy and possible electron microscopy
(EM). EM is reserved for special situations
in which it may substantially contribute to
the diagnosis. The fixed specimen should
have dimensions similar to those of the
fresh specimen. It must be handled properly
to maintain orientation of the fibers, to
keep the fibers at rest length, and to
prevent contraction.
The sample is optimally removed from the
patient by using a special clamp designed
for this purpose, such as the 10-mm Rayport
clamp (see Media
file 4). A segment of muscle of the
desired dimensions is dissected. The bottom
portion of the clamp is inserted below this
segment of muscle in the posts-up position
so that the length of the fibers runs
perpendicular to the jaws of the clamp.
After the bottom portion of the clamp is
inserted, the top portion of the Rayport
clamp can be folded over and the holes
fitted onto the bottom posts. The surgeon
then excises the fibers 1-2 mm external to
the clamp. The specimen is placed in
fixative. The preferred fixative is 4%
paraformaldehyde.
If a special clamp is not available for
the procedure, alternative methods of
obtaining the fixed specimen are available.
It can be obtained in a manner similar to
how fresh specimen are obtained and sent to
the laboratory fresh, where the
technologists perform the procedures needed
for immobilization and fixation. Another
method involves suturing the specimen to a
tongue blade for immobilization prior to
fixation.
If paraformaldehyde is not available, 10%
neutral buffered formalin is an acceptable
alternative for most light microscopic
purposes. If, however, EM is desired, the
specimen initially fixed in paraformaldehyde
has ultrastructural preservation better than
that of a sample fixed in formalin.
Paraformaldehyde is also superior to
formalin for immunohistochemical studies for
surface markers.
If paraformaldehyde is not available and
EM is anticipated, a small portion of muscle
can be placed directly in 3% glutaraldehyde
at the time of biopsy for submission to the
EM laboratory. This sample should be
maintained at rest length before it is
immersed in the fixative to prevent
contraction of the muscle. The specimen
placed in glutaraldehyde must be small
because glutaraldehyde penetrates tissue
slowly.
After overnight fixation, the
technologist separates a small section and
submits it in glutaraldehyde for embedment
for EM. The remainder is submitted for
paraffin processing, with the end of the
specimen removed and placed in cross-section
and most submitted in longitudinal section.
Optional additional fresh specimen
An additional fresh specimen is required
in selected patients when the presence of a
metabolic myopathy or some of the muscular
dystrophies is strongly suspected. The
sample may be sent to specialized
laboratories for assessment of specific
enzymatic activities (eg, mitochondrial
enzymes) or for measurement of specific
protein constituents in muscle (eg, protein
dystrophin).
This specimen should be of dimensions
similar to those of the other specimens and
should be snap frozen in liquid nitrogen at
the location of the procedure because of the
lability of some of these cellular
constituents. Store it in a freezer at
-70°C. Alert laboratory personnel in advance
if the need for this type of specimen is
anticipated. Many medical centers are not
equipped to perform this service.
Studies performed on the biopsy sample
Light microscopy
The actual methods for performing the
stains can be found in histology textbooks
and pathology laboratory manuals.
Immunohistochemical stains must be performed
by a laboratory set up for this purpose. The
manufacturer provides instructions for use
of each individual antibody.
Frozen sample
For every muscle biopsy, a battery of
stains is performed on the frozen sample in
addition to the routine hematoxylin and
eosin (H-E) stain. These assist in the
evaluation of neurogenic or other types of
atrophy, metabolic diseases, and
demonstration of structural changes or
inclusions diagnostic of specific disorders.
These studies cannot be performed on
material that has been fixed and embedded in
paraffin. After review of the initial
battery of stains, if the clinical and
pathologic findings warrant, the pathologist
may decide to perform additional special
stains.
The battery of stains performed on every
biopsy includes the following:
- H-E: This stain is the routine
histologic stain used for evaluation of
basic tissue organization and cellular
structure.
- Nicotinamide adenine dinucleotide
tetrazolium reductase (NADH): With this
stain, the activity of this group of
enzymes is demonstrated by the transfer
of hydrogen to a compound that turns
gray-blue when it is reduced. These
enzymes are found in mitochondria and
endoplasmic reticulum. This stain is
used to assist in evaluating for
neurogenic atrophy, mitochondrial
disorders, and central core disease and
is useful in detecting subtle
alterations of intracellular structure
in a myofiber that suggest it is not
well.
- Fiber-typing stains: Muscle is
composed of 2 main myofiber types: 1 and
2. Many disease processes
characteristically affect 1 type or the
other, resulting in atrophy of either
type 1 or 2 myofibers. Other processes,
such as neurogenic atrophy, alter the
distribution of both types.
-
- Most laboratories use a myosin
adenosine triphosphatase (ATPase)
stain at multiple pH levels to
demonstrate the different fiber
types. This is a difficult,
labor-intensive stain to perform.
-
- An immunohistochemical stain for
the different myosin heavy chains
found in type 1 and type 2 myofibers
is an alternative method for
demonstrating the 2 types of
myofiber. The limitations of this
method are not well defined at this
time. (Novocastra [Newcastle upon
Tyne, England] recommends it for
research purposes only.)
Immunohistochemical stains are now
available for different forms of
myosin ATPase.
- Modified Gomori trichrome: This
stain is particularly helpful in
evaluating for the presence of
mitochondrial disorders, IBM, and
nemaline myopathy.
- Periodic acid-Schiff (PAS): This
stains glycogen and other
polysaccharides. It is most useful for
the diagnosis of glycogen storage
diseases. PAS also stains the basal
lamina of vessel walls, so it can be
useful for evaluating the structure of
vessels.
- Fat stains, Sudan Black, or oil red
O: These stains are used to demonstrate
the presence of neutral lipids in
muscle, which are normally present but
can exist in abnormal amounts or
distribution in carnitine deficiency,
some mitochondrial disorders, acquired
metabolic disorders (such as in
starvation) and nonspecific
abnormalities of the myofibers.
Additional special stains that can be
performed on the frozen sample when the
clinical history and findings in the initial
battery of stains warrant include the
following:
- For muscular dystrophies,
immunohistochemical studies for
dystrophin, sarcoglycan, merosin, and
other structural proteins can be
performed. The results of these then can
be used to direct special biochemical
analysis that will lead to a specific
diagnosis.
- For some metabolic disorders, the
enzymatic activities of
myophosphorylase, phosphofructokinase,
myoadenylate deaminase, succinic
dehydrogenase (SDH), and cytochrome
oxidase (COX) can be performed.
- For dermatomyositis,
immunofluorescence can be performed to
look for membrane attack complex of
complement in vessel walls.
Paraffin specimen
Paraffin sections are usually stained
with H-E. This specimen consists of a large
surface of fibers oriented in the
longitudinal direction and a piece in
cross-section. A relatively large amount of
tissue usually is exposed in each paraffin
section; therefore, this specimen is
extremely useful for evaluating for
processes with a nonuniform distribution
(eg, inflammatory myopathies, vasculitis).
The fixed and paraffin-embedded specimen
maintains more cellular detail than the
frozen specimen, making it the preferred
sample for detecting subtle evidence of
myofiber necrosis, for determining the type
of inflammatory infiltrate present, and for
examining the structure of vessels walls.
When indicated, special stains can be
performed on the paraffin specimen. These
include the following:
- Special stains for organisms, such
as bacteria, fungi, and parasites
- Elastic stains to evaluate for
disruption of the elastic lamina of
arteries in vasculitis
- Immunohistochemical stains to
determine the subtypes of inflammatory
cells within an infiltrate and a variety
of other purposes
- In situ hybridization for
identification of viruses
- Congo red or thioflavin S staining
for amyloid
Electron microscopy
While a small sample of every muscle
biopsy should be set aside for possible EM,
performing EM muscle biopsy samples is not a
routine procedure. It is reserved for
selected circumstances in which the
pathologist determines that EM has the
potential of contributing significantly to
determining a specific diagnosis. The
pathologist uses knowledge of the clinical
history and findings of light microscopic
studies to decide if EM is indicated.
EM is costly, time-consuming, and
requires a specialized laboratory and
technical expertise. Some technical aspects
of EM are described below.
- Fixation: If the specimen is fixed
in paraformaldehyde, it is transferred
to 3% glutaraldehyde after sufficient
time has passed for the paraformaldehyde
to penetrate the tissue. This depends on
the size of the specimen, but overnight
fixation is more than satisfactory for
this. Glutaraldehyde may provide a bit
more cross-linking of the membranes,
which is needed for EM.
-
- If paraformaldehyde is not
available, the tissue, held at rest
length by pinning to cork, can be
placed directly in glutaraldehyde.
Because glutaraldehyde does not
penetrate the tissue as well as
paraformaldehyde, a specimen placed
in glutaraldehyde must be small,
approximately 1-2 mm in width and
depth. Glutaraldehyde makes tissue
brittle and interferes with
immunohistochemical studies, so it
is not appropriate for the paraffin
specimen.
-
- If the tissue is fixed in
formalin, it is not as well
preserved for EM as it is with
paraformaldehyde or glutaraldehyde.
Performing EM on tissue fixed only
in formalin is possible, but the
results are suboptimal. Cutting
tissue out of a paraffin block or
removing it from a slide is possible
for EM, but the likelihood of
obtaining useful results with these
methods is limited.
- Embedding the tissue: After
fixation, the tissue is divided into
1-mm3 samples, postfixed with
osmium tetroxide, and embedded in epoxy
resin. Samples are oriented in either
longitudinal or transverse direction
prior to polymerization of the resin.
The process of embedment requires 2
days.
- Survey sections: Survey sections for
light microscopy, 1 micron in thickness,
termed semithin or thick sections, are
cut from the material embedded in
plastic. The pathologist reviews these
and areas of interest are chosen for EM.
- Thin sections: An ultramicrotome
with a diamond knife is used to cut
sections for ultrastructural study.
These then are stained with uranyl
acetate and lead citrate. They are
placed in an EM and examined.
- Selected clinical circumstances in
which EM is useful include the
following:
-
- When seeking evidence to support
a diagnosis of dermatomyositis, EM
can be used to look for
tuboreticular inclusions (TRIs) in
endothelial cells. If light
microscopic findings are diagnostic,
EM is not necessary.
-
- EM can be used to identify
inclusions found by light
microscopy.
-
- EM can help to characterize
stored material found on light
microscopy and define its
intracellular localization.
-
- EM can be used to analyze
structural abnormalities found by
light microscopy.
-
- EM can assist in the diagnosis
of mitochondrial myopathy.
-
- EM almost never is indicated for
a muscle that is normal at the light
level. If normal muscle is found
with all of the light microscopic
studies, then this is exactly what
EM will show, only larger. The only
common exception to this guideline
is in the setting of a strong
clinical suspicion for
dermatomyositis with normal light
microscopic studies. If TRIs are
found, they can lend some support to
this diagnosis.
Normal Skeletal Muscle
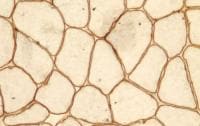
Basic structure and terminology
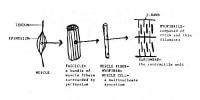
A layer of dense connective tissue, which
is known as epimysium and is continuous with
the tendon, surrounds each muscle (see
Media file 5). A muscle is composed of
numerous bundles of muscle fibers, termed
fascicles, which are separated from each
other by a connective tissue layer termed
perimysium. Endomysium is the connective
tissue that separates individual muscle
fibers from each other. Mature muscle cells
are termed muscle fibers or myofibers. Each
myofiber is a multinucleate syncytium formed
by fusion of immature muscle cells termed
myoblasts.
Sarcoplasm, the cytoplasm of each
myofiber, is occupied largely by the
contractile apparatus of the cell. This is
composed of myofibrils arranged in
sarcomeres, which are the contractile units
of the cell. The sarcomeres contain a number
of proteins, including alpha actinin, which
form a major portion of the Z band, and
actin and myosin, which form the thin and
thick filaments, respectively. The remainder
of the sarcoplasm, located between the
myofibrils, is termed the intermyofibrillar
network and contains the mitochondria,
lipid, glycogen, T-tubules, and sarcoplasmic
reticulum. T tubules and sarcoplasmic
reticulum are responsible, respectively, for
conduction of electrical signals from the
cell surface and intracellular storage and
release of calcium required for contraction
to occur.
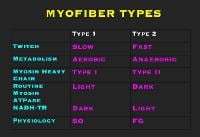
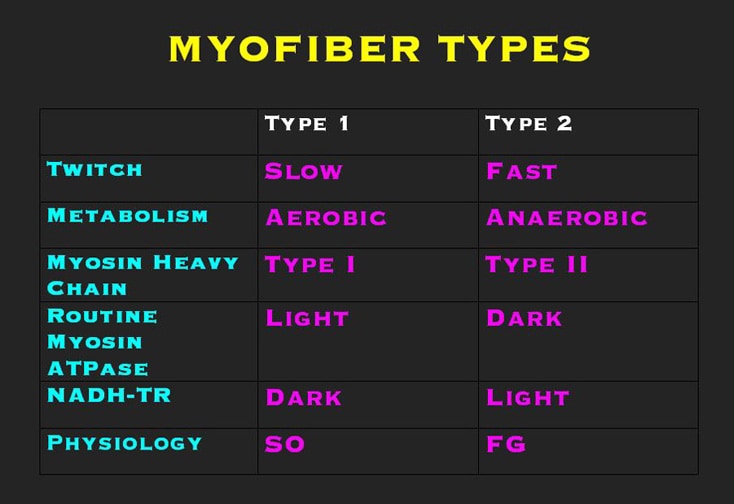
Myofiber types
The 2 basic myofiber types are type 1 and
type 2. The designation of these types is
based on their physiologic properties, which
are correlated with their cellular
structural specializations and are reflected
in their histochemical properties (see
Media file 6).
Type 1 myofibers are the slow fibers.
Physiologists refer to them as
slow-oxidative, or SO, fibers. They have a
slow contraction time following electrical
stimulation, and they generate less force
than do type 2 myofibers. If the response of
a muscle to the application of gradually
increasing loads is measured, the slow
fibers are recruited first. They are used
for sustained, low-level activity. To
accomplish this, they are equipped with
numerous large mitochondria and abundant
intracellular lipid for oxidative
metabolism.
Type 2 myofibers are the fast fibers.
Physiologists call these the
fast-glycolytic, or FG, fibers. They have a
rapid contraction time following
stimulation. If the response of a muscle to
the application of gradually increasing
loads is measured, the fast fibers are
recruited late. They are used for
brief-duration activity in carrying heavy
loads and are specialized for anaerobic
metabolism. These fibers contain smaller,
less numerous mitochondria, less lipid, and
have higher glycogen stores than type 1
fibers. The subgroups of type 2 fibers are
not discussed here.
Each muscle has a characteristic ratio of
type 1 to type 2 myofibers. For example, in
the vastus lateralis, the most commonly
biopsied muscle, more than 50% of the
fibers, as many as two thirds, are expected
to be type 2 myofibers. In the deltoid
muscle, another muscle commonly evaluated
with biopsy, typically the balance favors
type 1 myofibers. In normal muscle, the 2
myofiber types are interspersed in a random
interdigitating pattern. The 2 myofiber
types are normally similar in size.
Information about changes in the myofiber
types in a muscle biopsy often provides
significant clues in making the diagnosis.
Different pathologic processes alter the
ratio of the myofiber types and their
distributions in the muscle and may
selectively affect the size of 1 type or the
other or of both equally.
Innervation of a particular muscle fiber
determines whether it is type 1 or type 2.
Therefore, if the type of motor neuron
innervating a myofiber is changed, that
myofiber acquires a new phenotype from its
new innervation. Pathologists take advantage
of this fact to evaluate for evidence of
neurogenic disease of muscle. In a muscle in
which denervation has been followed by
reinnervation due to sprouting of residual
viable motor neuron terminals, groups of
myofibers of a single type are present
instead of the random interdigitation
normally found.
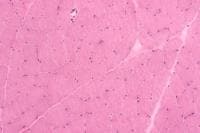
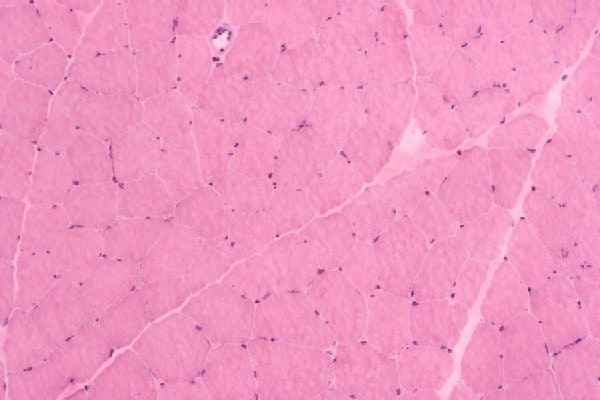
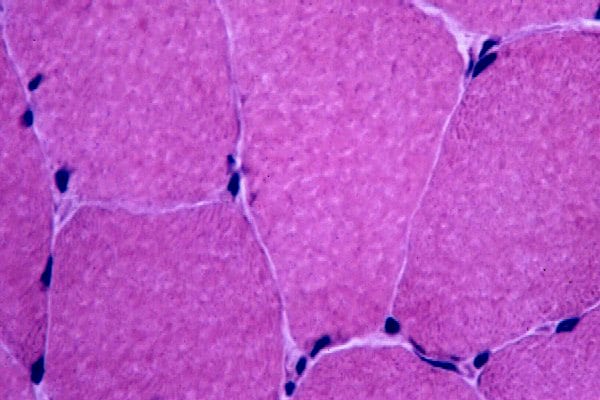
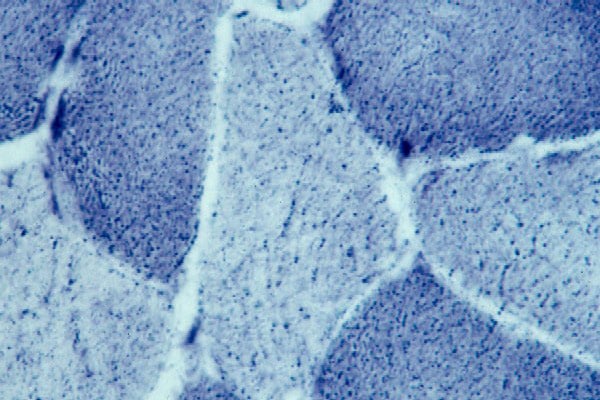
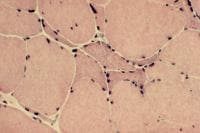
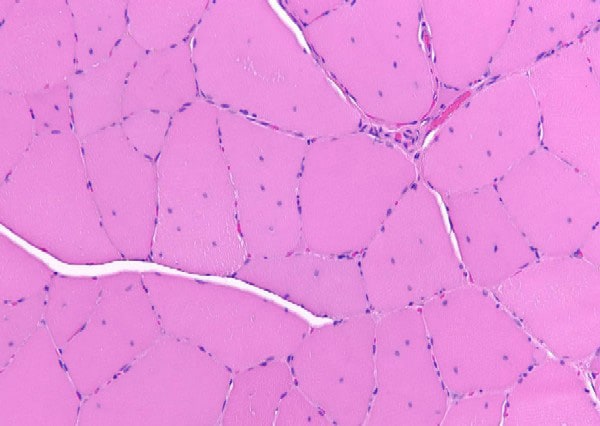
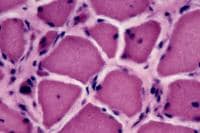
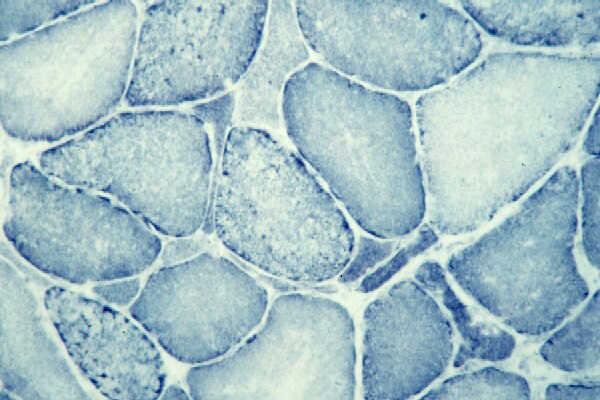
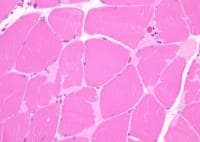
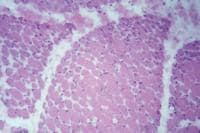
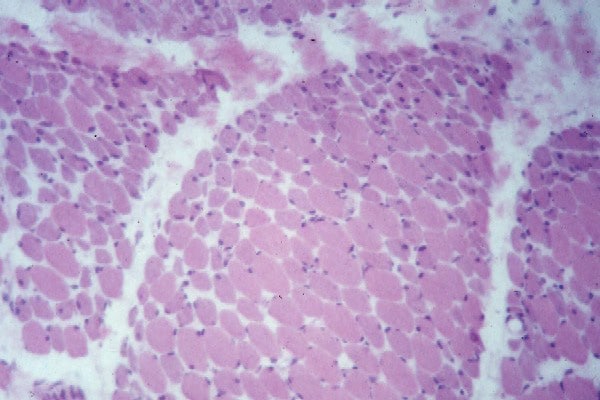
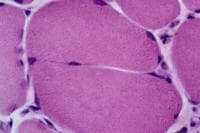
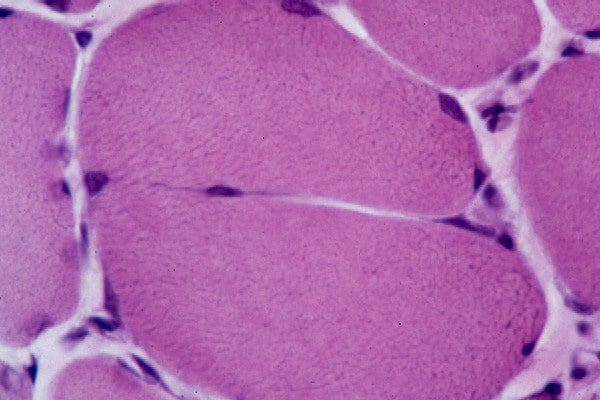
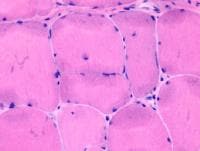
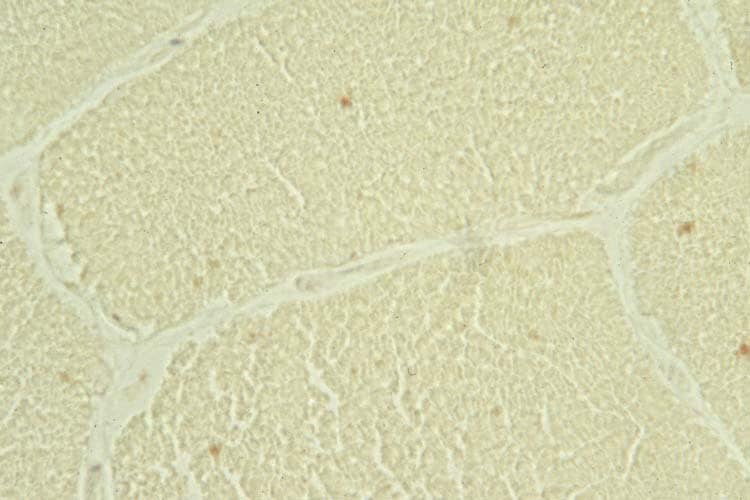
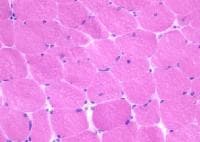
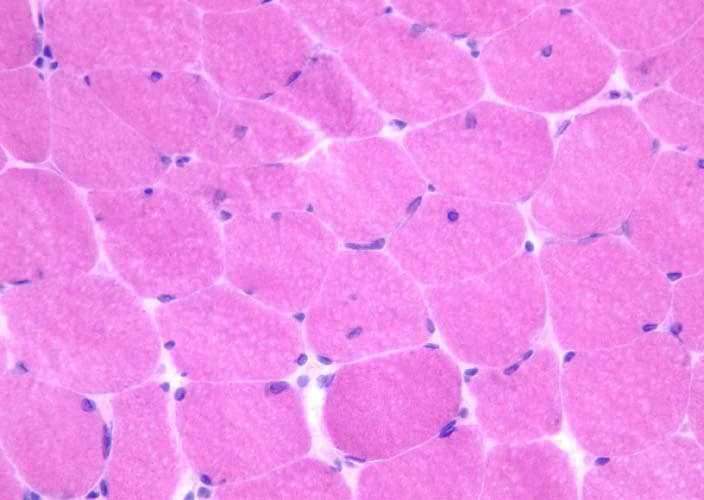
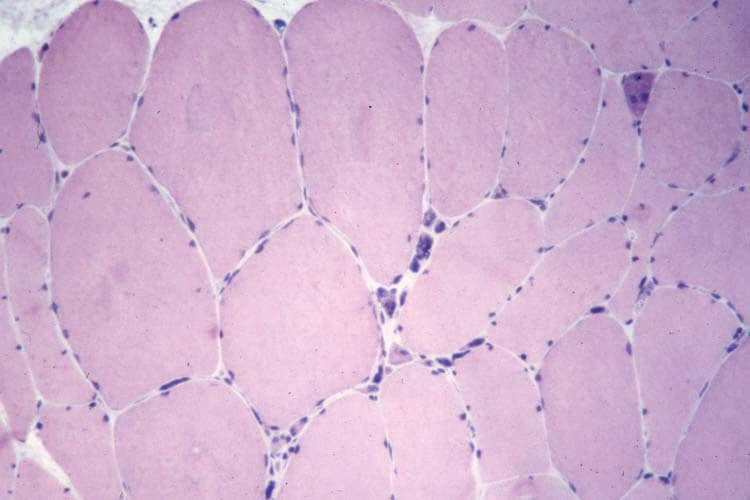
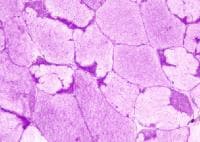
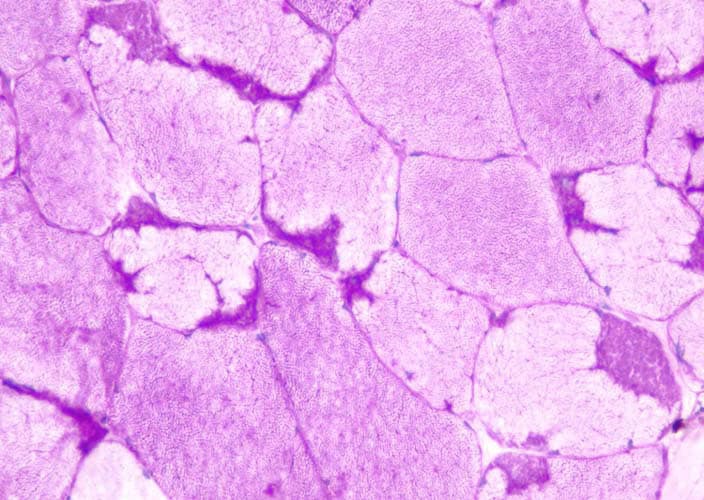
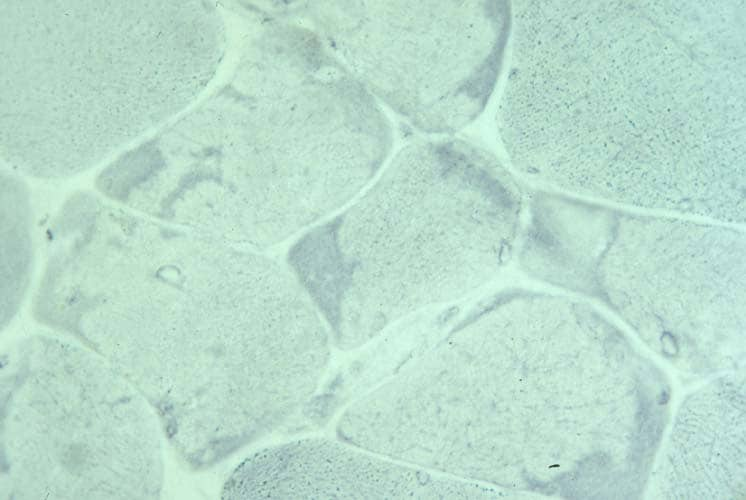
Histology
With frozen-section H-E, a cross-section
of a frozen sample of normal skeletal muscle
stained with H-E (see
Media file 7) shows several fascicles
surrounded by and separated from each other
by a thin layer of perimysium. The muscle
fibers are of relatively uniform size and
shape, with nuclei located at the periphery
of the cell. In normal muscle, less than 3%
of fibers should have internal nuclei
(located in the center of the fiber). The
fibers fit together in a mosaic pattern. At
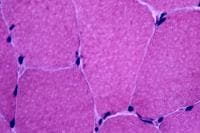
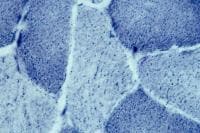
high power (see
Media file 8), the endomysium separating
the myofibers can be observed as normally so
thin and delicate it is almost invisible and
the contiguous myofibers appear to have
almost no space between them. The sarcoplasm
is relatively uniform throughout the cell.
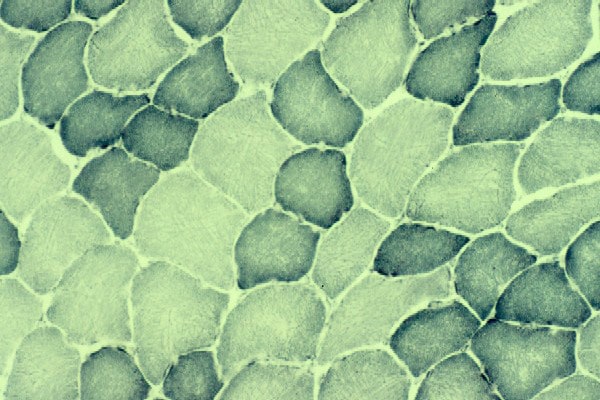
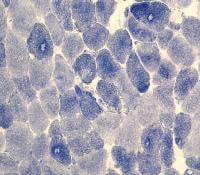
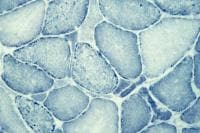
On the section stained with NADH (see
Media file 9), which stains
predominantly mitochondria in the
intermyofibrillar network, the type 1
myofibers are darker than type 2 myofibers.
In normal muscle, the stain is distributed
fairly uniformly throughout the sarcoplasm.
High power (see
Media file 10) allows observation of the
distribution of the stain in a punctate
pattern, where it is localized mostly to the
mitochondria in the intermyofibrillar
network.
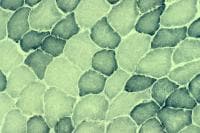
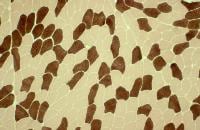
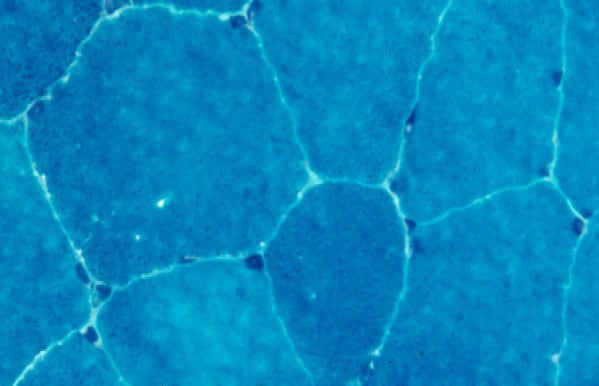
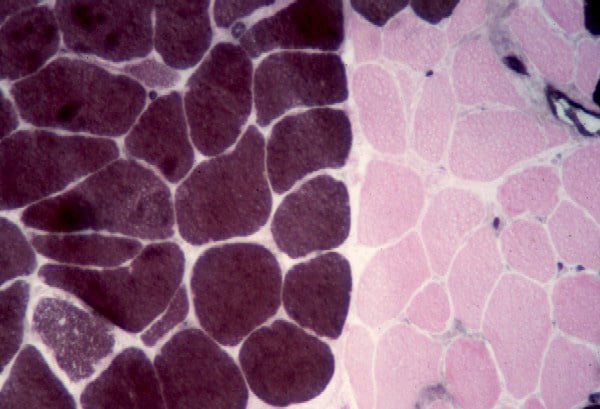
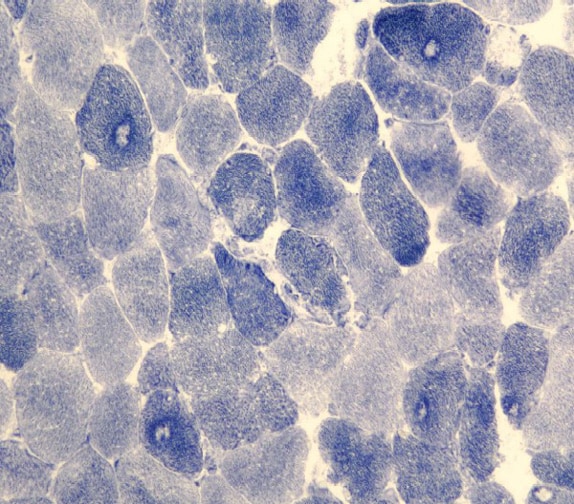
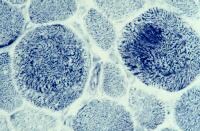
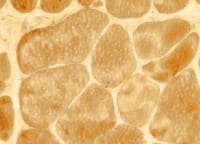
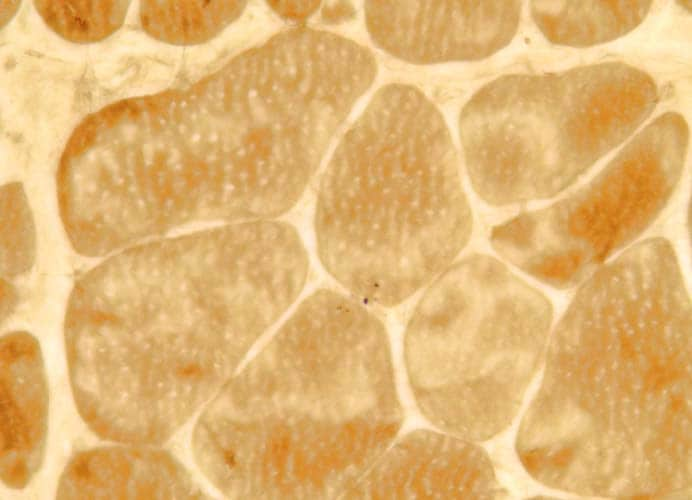
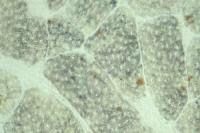
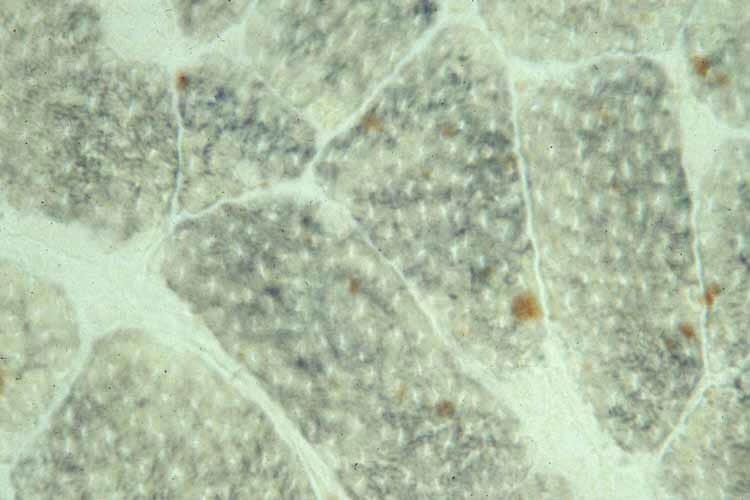
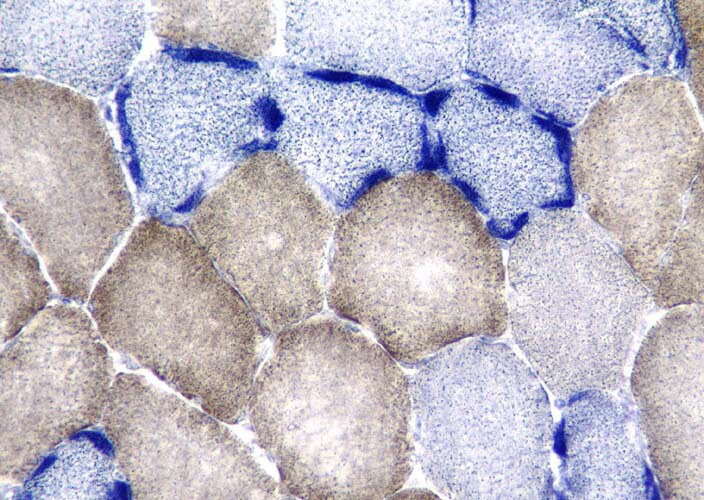
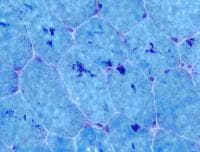
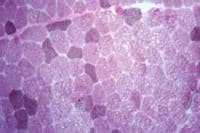
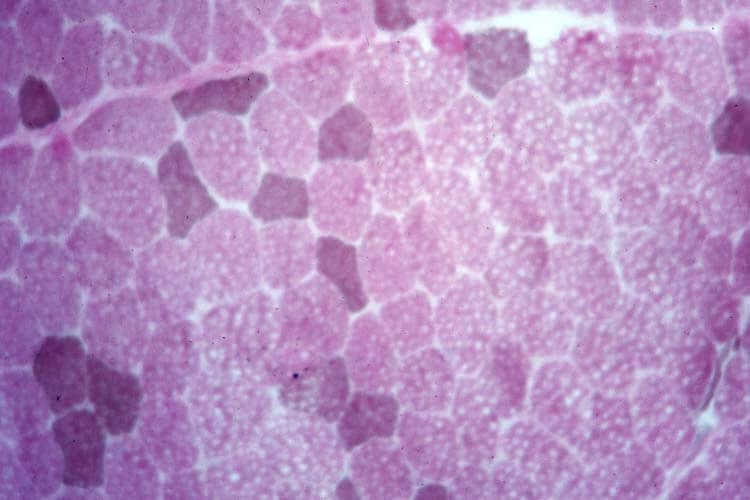
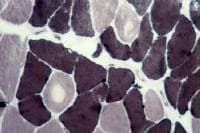
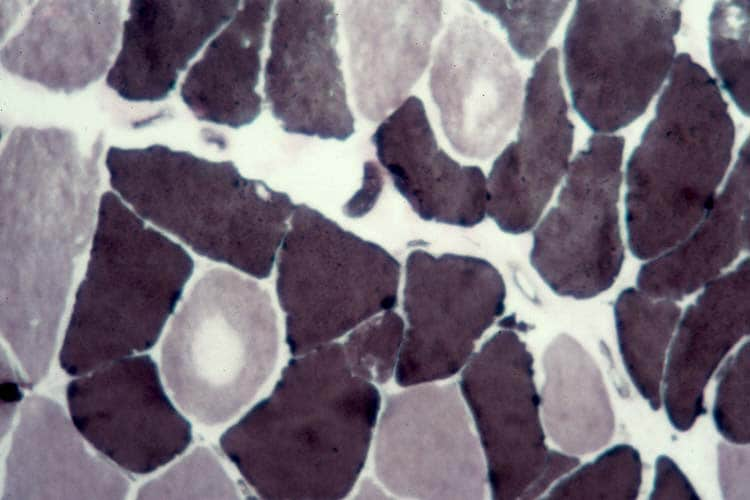
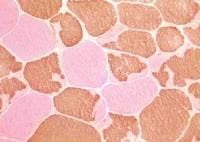
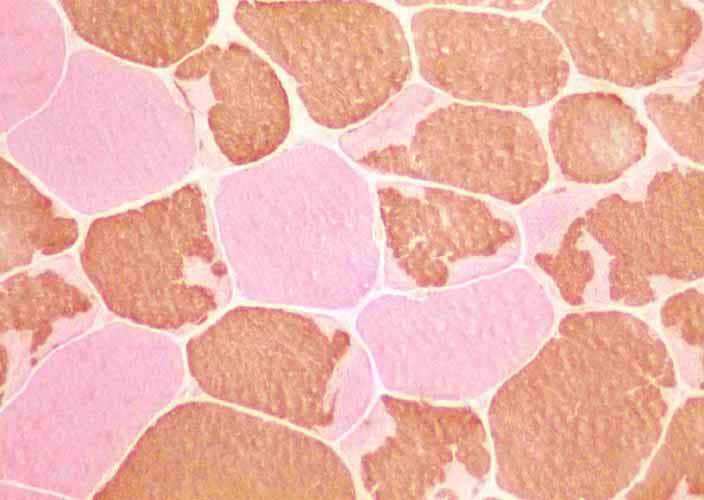
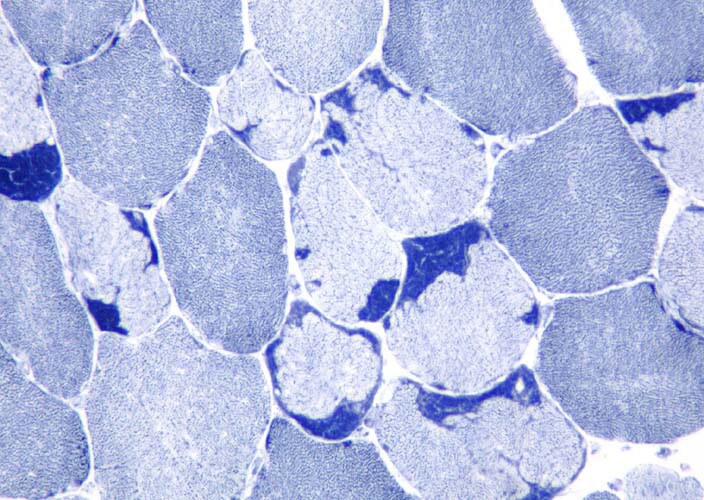
On the frozen-section fiber-typing stains
in
Media file 11, which are treated with
the stain for myosin ATPase at pH 10.5
(actual pH varies among laboratories), type
2 myofibers are stained brown, and type 1
fibers are stained pink with an eosin
counterstain to make them visible. This
section demonstrates the normal, random,
almost checkerboard distribution of the 2
types of myofibers. The same stain,
performed at a pH of 4.3, demonstrates
staining of the type 1 myofibers, so the
slide would have exactly the reverse pattern
of that seen on the image. An alternative to
the technically difficult myosin ATPase
stain is the immunohistochemical stain for
myosin heavy chain.
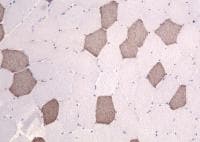
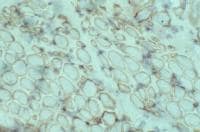
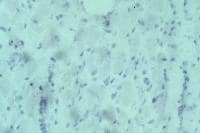
Media file 12 shows the stain for myosin
heavy-chain slow, which stains the type 1
myofibers. In
Media file 13, a section from the same
patient is stained for myosin heavy-chain
fast, which stains the type 2 myofibers.
With frozen-section PAS staining, PAS is
distributed fairly uniformly across a normal
myofiber (see
Media file 14). It is located mostly in
the intermyofibrillar network, which
contains much of the intracellular glycogen
content. Normally, the type 2 myofibers
stain darker with this stain than type 1
fibers, because the type 2 fibers use
glycolysis more than type 1 fibers.
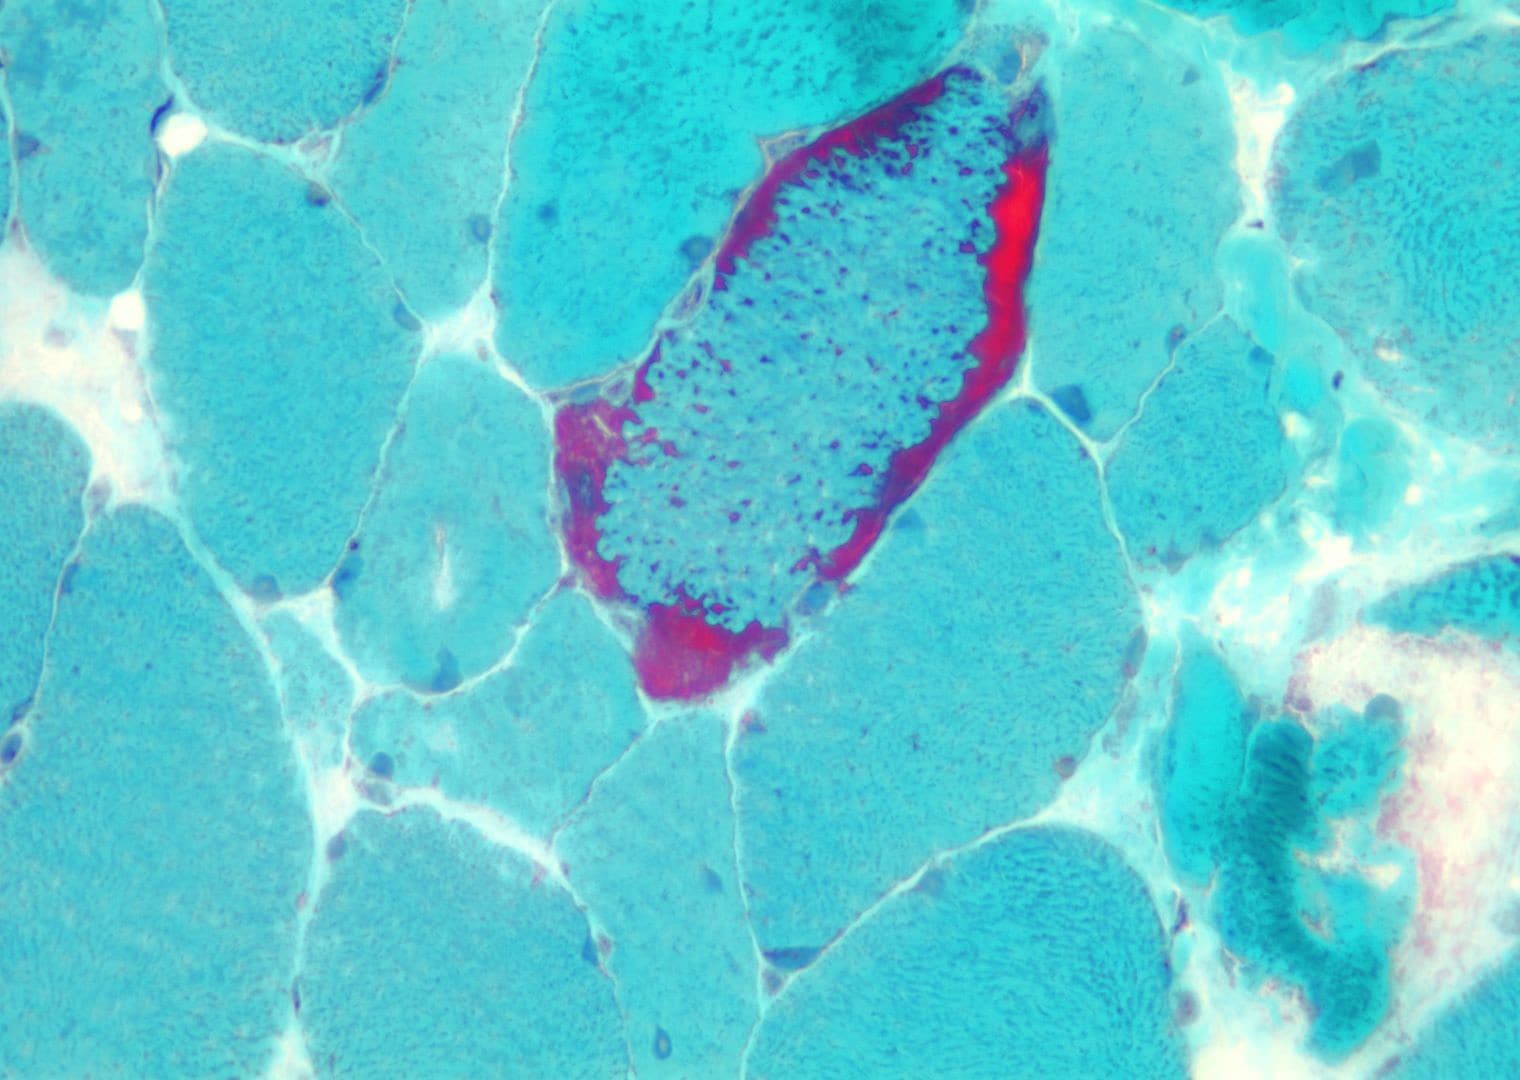
With the modified frozen-section Gomori
trichrome stain (see
Media file 15), the myofibers and
connective tissue stain slightly different
shades of blue-green. Nuclei normally are
red. The intermyofibrillar network exhibits
punctate red staining, which normally is
inconspicuous.
With the frozen-section lipid Sudan Black
stain (see
Media file 16), intracellular lipid
appears brown-black and is distributed
throughout the intermyofibrillar network.
Type 1 myofibers stain darker than the
others because of their increased reliance
on oxidative metabolism. For this reason,
type 1 fibers have a greater lipid content
than the type 2 myofibers, which rely more
on anaerobic than oxidative metabolism.
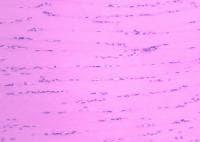
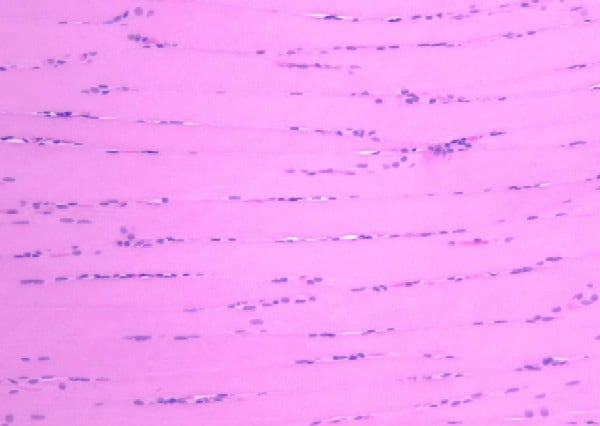
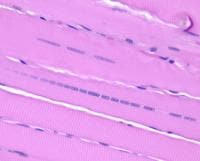
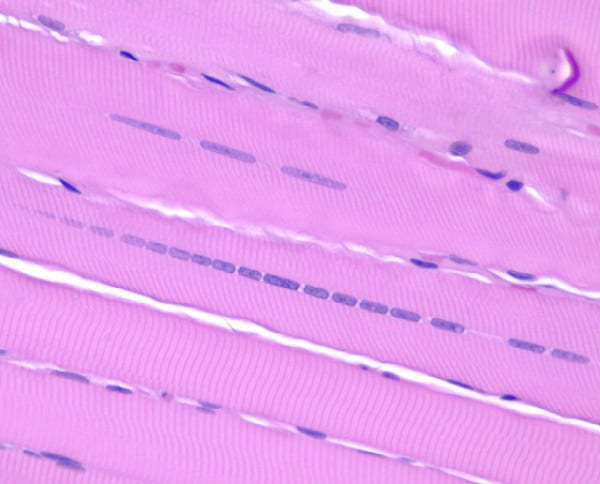
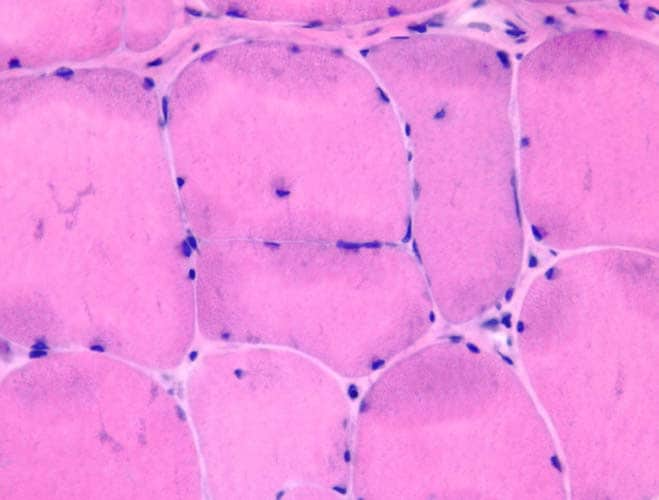
Paraffin section: The paraffin section is
stained with H-E. In a low-power view of the
paraffin section (see
Media file 17), the fibers are seen in
longitudinal section, forming an array of
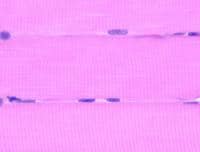
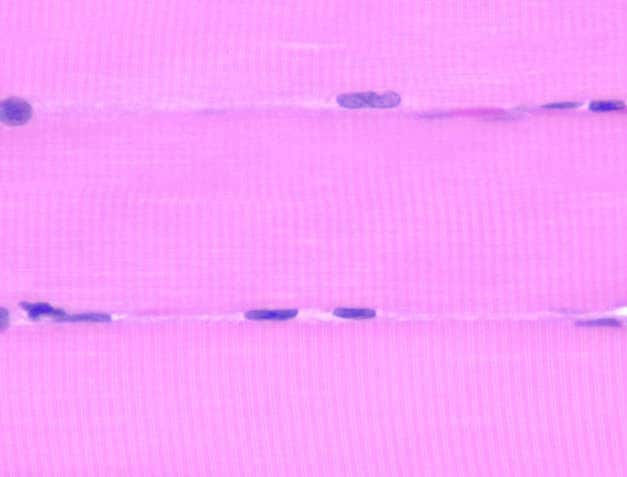
fibers lined up in parallel. At high power
(see
Media file 18) in normal myofibers, the
striations, which are formed by the
sarcomeres, are demonstrated readily. One of
the earliest changes in myofiber necrosis is
loss of the striations. On occasion, this
subtle but important finding may be the only
pathologic change in a sample.
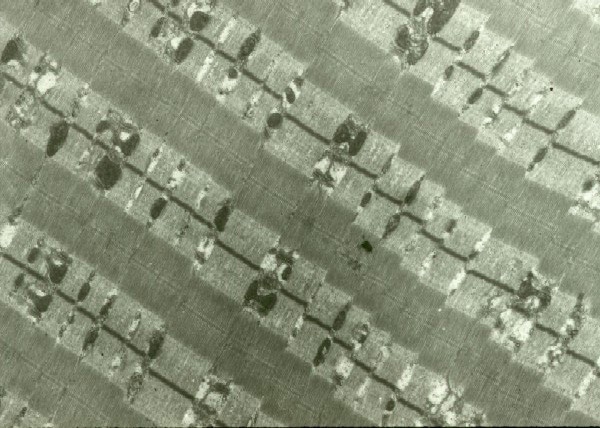
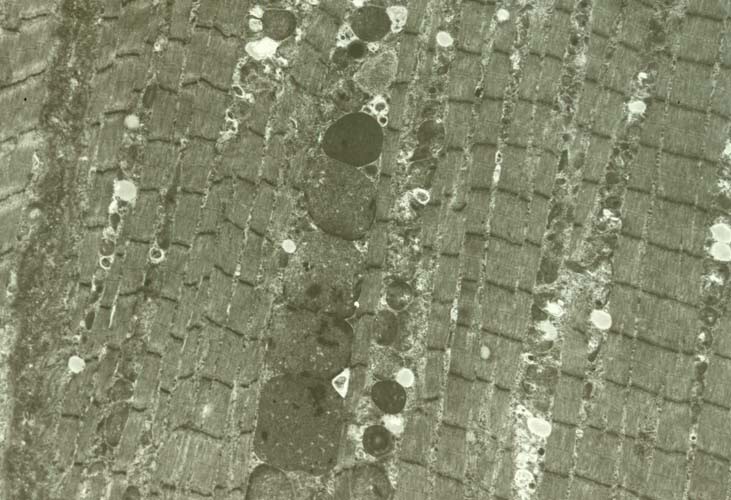
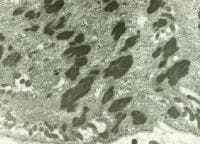
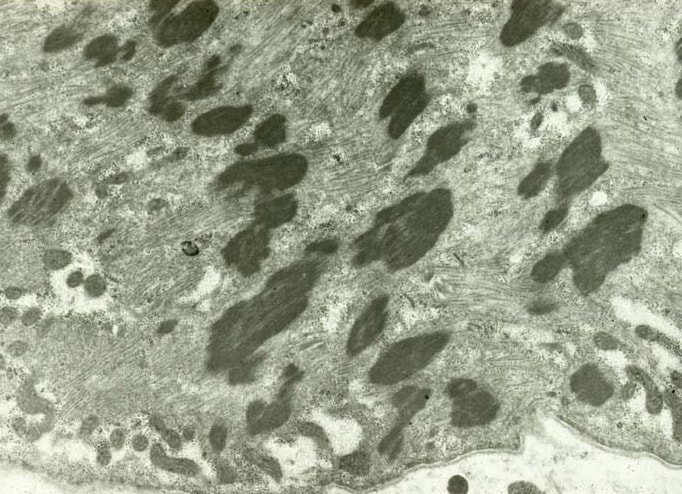
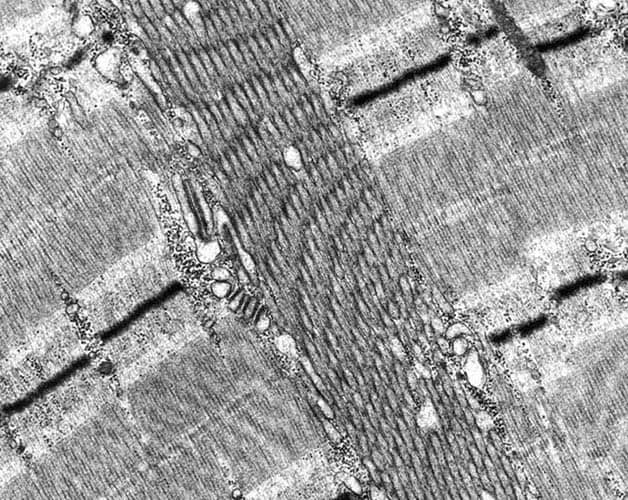
EM: Normal muscle in longitudinal section
(see
Media file 19) reveals the remarkable
ultrastructural architectural order of
skeletal muscle. The myofibrils are the
contractile machinery of the cell and are
arranged in units, the sarcomeres. The
boundary of each is a thin dark line, the Z
disk or Z band. This is the anchor for the
thin filaments, which are actin. The thin
filaments are best seen in the pale zones of
the sarcomere, known as the I band, adjacent
to each Z disk. The broad darker central
region of each sarcomere is the A band,
formed mostly by the overlap of the thick
myosin filaments and the thin filaments. In
the center of each sarcomere is a thin dark
band termed the M band, flanked by thin pale
H zones, where the thick and thin filaments
do not overlap.
Between the myofibrils, the sarcoplasm
contains the intermyofibrillar network.
Mitochondria are the moderately dense oval
structures located adjacent to the I bands.
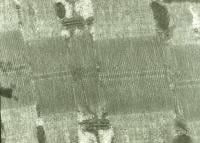
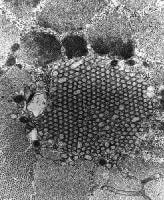
At high power (see
Media file 20), the intermyofibrillar
network contains glycogen, which can be seen
as dark granular material distributed
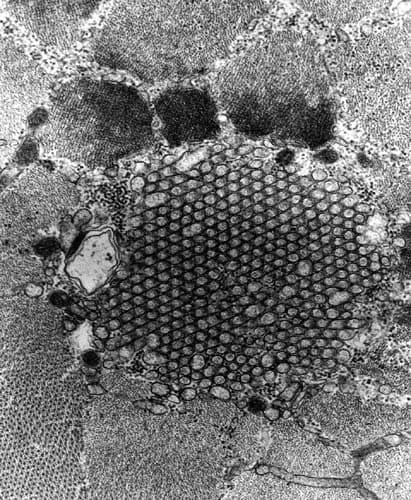
diffusely through this area. The triads also
are visible. Each triad is formed by a
segment of the T tubule flanked on either
side by the lateral sacs of the sarcoplasmic
reticulum. The T tubule is continuous with
the sarcolemma, which is the plasma membrane
of the myofiber, from which it rapidly
transmits the muscle cell action potential
throughout the cell. Excitation transmitted
from the T tubule to the sarcoplasmic
reticulum is responsible for the
intracellular release of calcium required
for contraction that normally is sequestered
from the myofibrils when the muscle cell is
at rest.
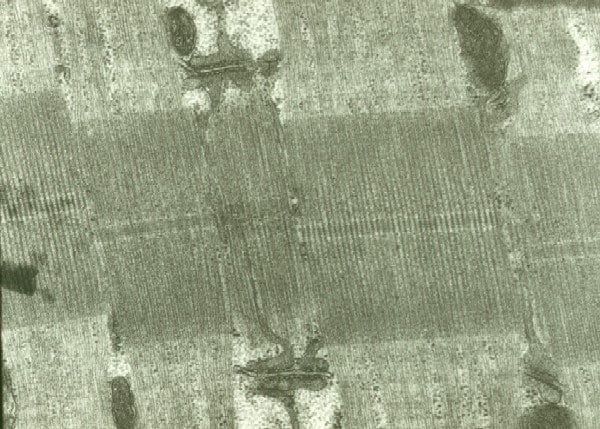
Distinguishing type 1 and type 2
myofibers is possible on the basis of their
ultrastructural appearances. Type 1 fibers
(see
Media file 21) contain abundant, fairly
large, prominent mitochondria and abundant
fat. The mitochondria are the ovoid
structures, and the fat is contained in pale
homogeneous round structures. Type 2 fibers
(see
Media file 22) contain smaller, less
abundant, less prominent mitochondria.
Glycogen is abundant, and lipid is more
difficult to find in these myofibers than
elsewhere. These ultrastructural
specializations are correlated with the
functional roles of the 2 fiber types.
Results of improper handling
Compare the appearances of improperly
handled specimens with those of properly
handled specimens.
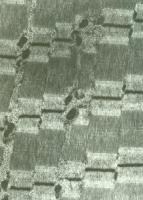
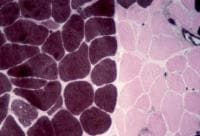
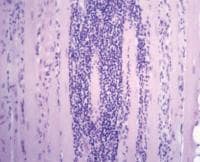
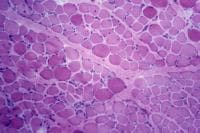
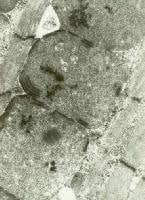
The specimen shown in
Media file 23 arrived at the laboratory
stuck to dry ice. This improper handling
caused uneven freezing of the specimen and
freeze artifact, resulting in disruption of
the sarcoplasmic features and a loss of
information about the state of the
myofibers.
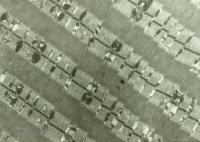
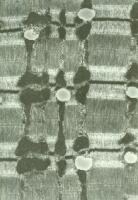
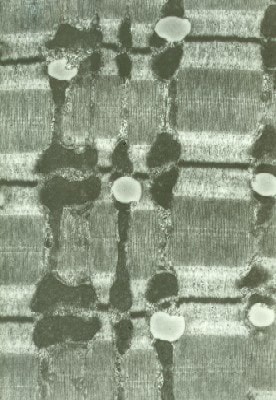
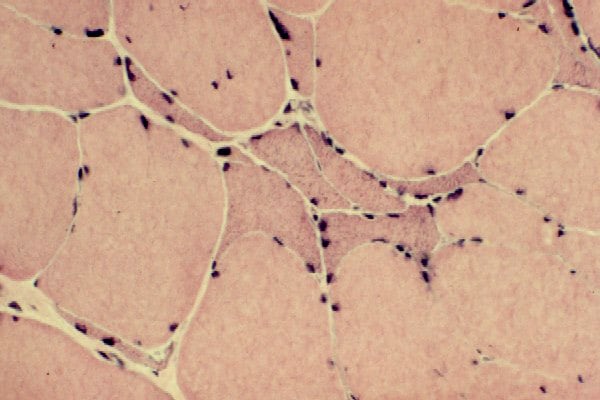
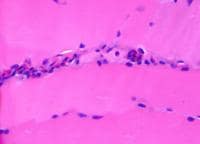
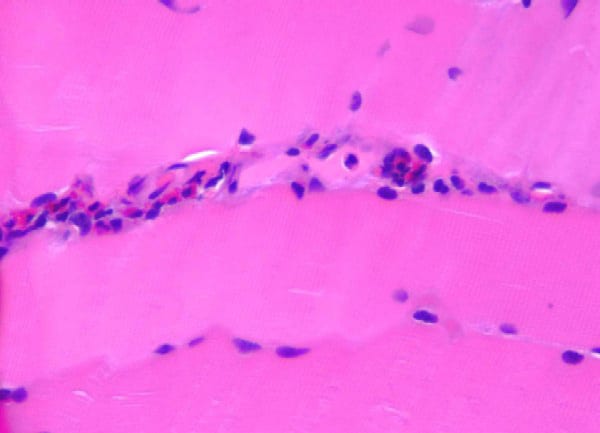
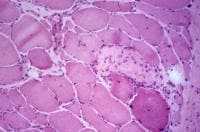
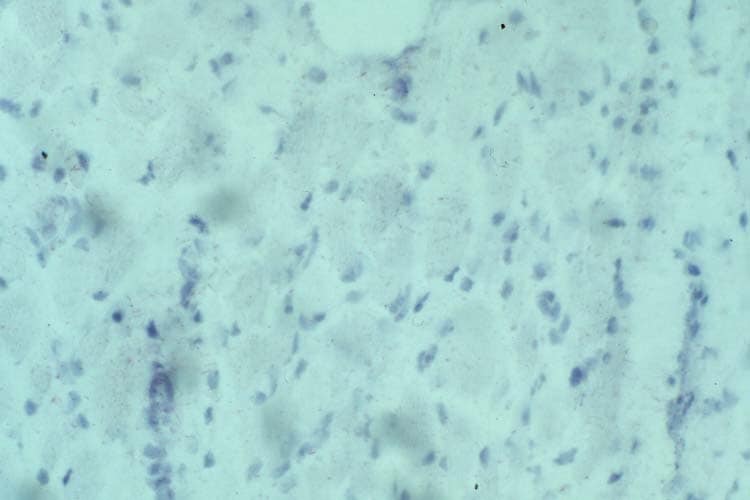
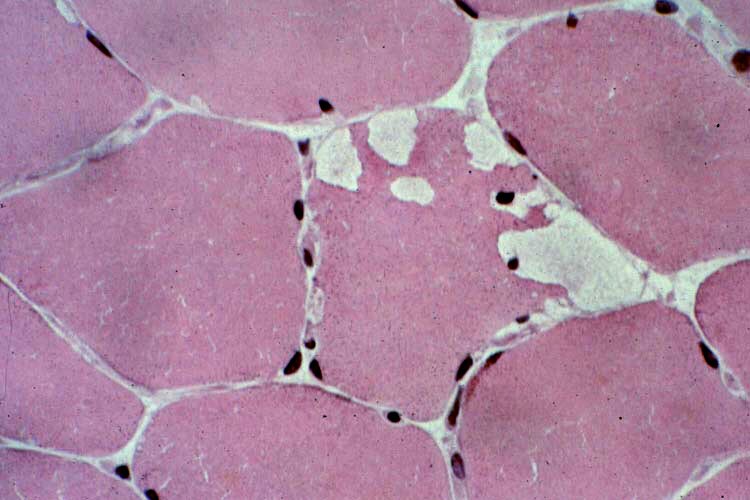
Media file 24 is from a case in which
the muscle specimen was immersed in cold
fixative without prior immobilization by a
clamp. This allowed the muscle to
hypercontract, producing the appearance of
contraction bands, a finding that can be
associated with myofiber necrosis. However,
in this situation, this finding is
meaningless.
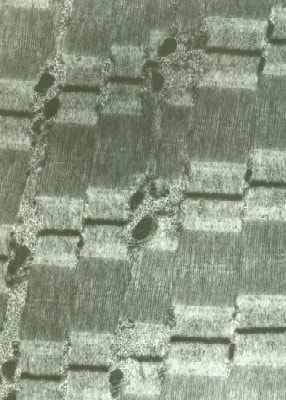
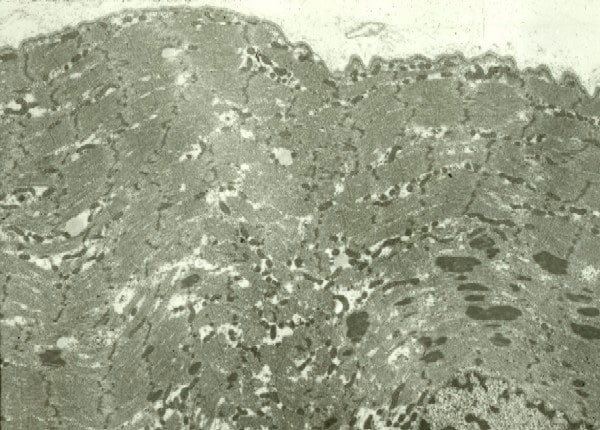
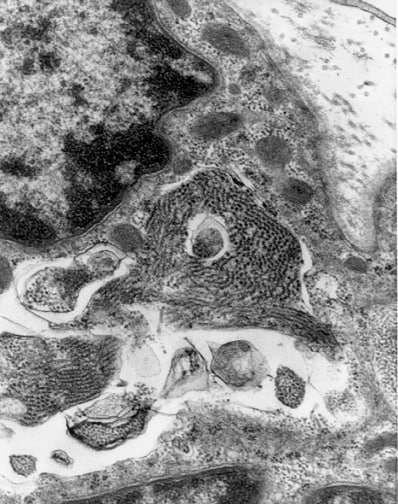
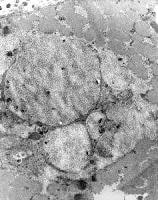
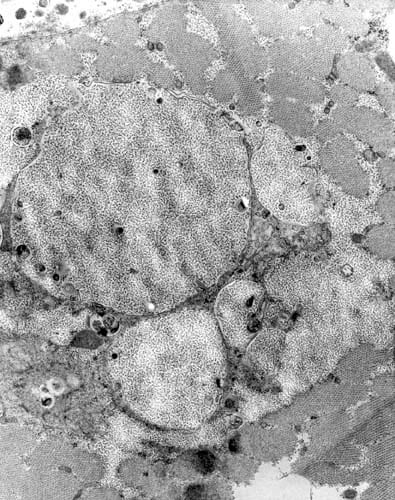
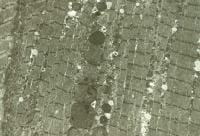
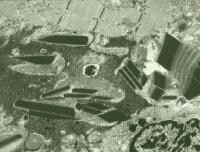
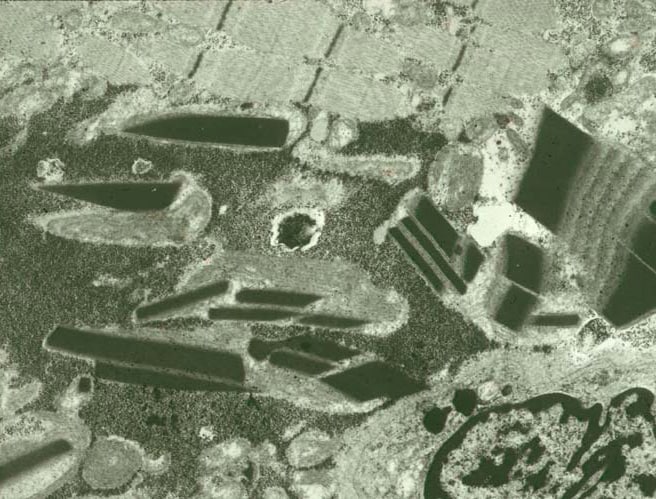
Media file 25 is an EM of a specimen of
muscle in which the surgeon was instructed
to mince the muscle sample before submitting
it in glutaraldehyde. The photograph
demonstrates the serious disruption of the
normally orderly ultrastructural
architecture of the myofiber caused by this
procedure.
In all 3 of these situations, improper
handling of the muscle specimen at the time
of biopsy in the operating room could have
made it impossible to make a diagnosis.
Fortunately, in each of these examples, a
diagnosis was possible.
Introduction to Skeletal Muscle
Pathology
Interpretation of a muscle biopsy results
can be a challenging task. The opinion of
the muscle pathologist is often required in
combination with the observation of a
variety of histopathologic findings and a
consideration of the clinical situation to
arrive at a diagnostic formulation that
makes sense for a given patient. This
process can be difficult because few
individual histologic findings are
diagnostic of a specific disorder.
For example, a biopsy may exhibit
myofibers that contain empty vacuoles on
H-E. This type of vacuole can be observed in
a variety of settings, including glycogen
storage disease, colchicine toxic myopathy,
critical care myopathy, periodic paralyses,
and technical artifact. The pathologist uses
a variety of strategies to decide which is
the most likely cause of the vacuoles in a
given case.
Many biopsy samples show numerous
findings in varying degrees, each of which
is consistent with an assortment of
diagnoses. The pathologist must judge the
clinical significance of each finding,
decide if and how it fits with the other
findings in the specimen, and determine what
light to cast on the biopsy result to best
fit the patient's presentation.
Neurogenic changes in muscle biopsy
The muscle can show neurogenic changes in
disorders that affect motor neurons,
including diseases of the anterior horn cell
(eg, motor neuron disease), motor
neuropathy, peripheral neuropathy, and
disorders that affect the intramuscular
nerve twigs. One of the common requests
accompanying muscle biopsies is to assist in
determining whether the patient has
neuropathy or myopathy. (See
Clinical and Laboratory Features of
Neuromuscular Disease for a discussion
of this issue.)
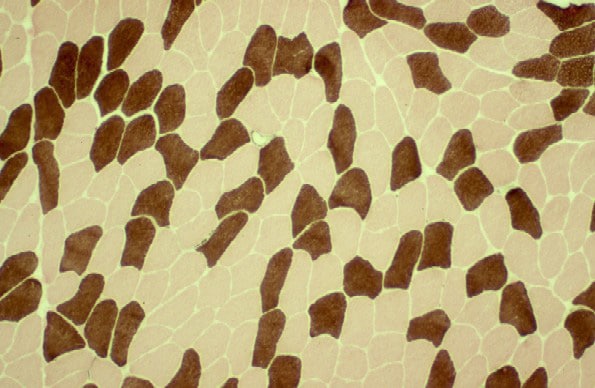
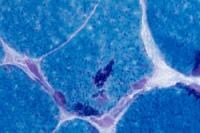
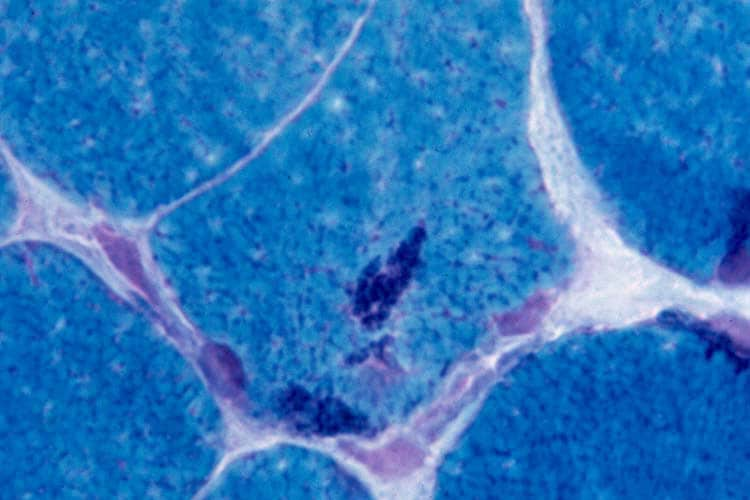
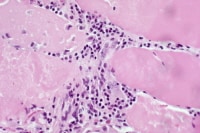
Neurogenic disorders have the following
characteristics on muscle biopsy:
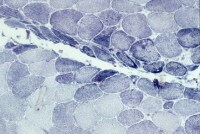
- Angulated atrophic fibers (see
Media file 26)
- Fiber-type grouping (see
Media file 27): This finding occurs
when denervation and reinnervation have
taken place. Innervation of a myofiber
determines its type. If a motor unit
that was originally innervated by a type
1 nerve loses its innervation, a number
of isolated angulated atrophic fibers
are initially scattered about a small
region of the muscle. If a neighboring
intact type 2 motor neuron sprouts and
reinnervates these myofibers, all of the
muscle fibers in the region become type
2. The muscle loses the normal random
checkerboard distribution of myofiber
types.
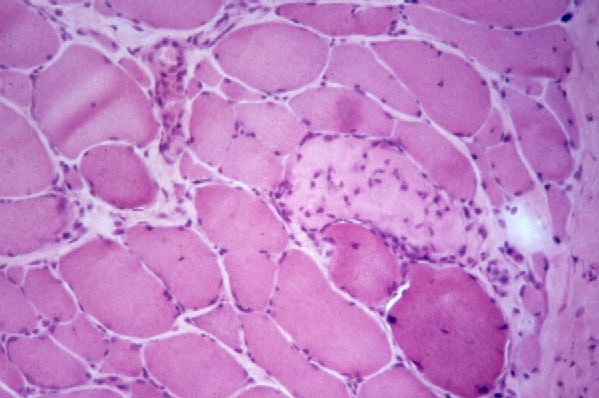
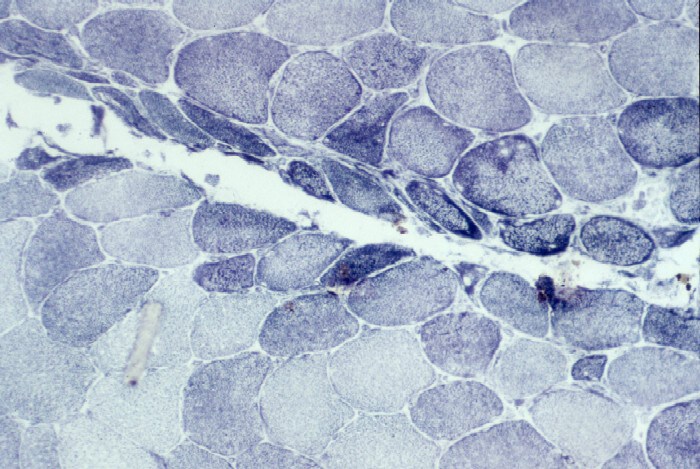
- Group atrophy (see
Media file 28)
- Target fibers (see
Media file 29)
- Nuclear clumps (see
Media file 30)
When all of these findings are present
and no other abnormalities are found in the
specimen, the diagnosis of neurogenic
atrophy and reinnervation is
straightforward. Often, the biopsy shows a
combination of neurogenic and myopathic
findings (see
Muscle
biopsy in myopathy). These may represent
myopathy that is secondary to the
neuropathic process or a separate primary
myopathic process. The pathologist can often
surmise the correct interpretation on the
basis of clinical findings, but the truth
occasionally cannot be determined with
certainty.
Many biopsy samples with inflammation
also demonstrate evidence of neurogenic
change. Myogenic denervation, in which the
sick muscle fibers lose their innervation,
can cause this change. The inflammatory
process overruns and entraps the
intramuscular nerve twigs in an
innocent-bystander mechanism, or the nerves
are concurrently inflamed.
Muscle biopsy in myopathy
A broad spectrum of pathologic findings
is present in myopathic disorders. Each
individual finding is usually nonspecific
and can be found in a variety of pathologic
processes. A single finding can have many
connotations and, in arriving at a
diagnostic impression, the pathologist must
always interpret the clinical significance
of the individual findings. The
constellation of pathologic findings in a
given clinical setting leads to the
diagnosis.
In contrast to the pathologic findings in
neuropathy, several findings are
characteristic of myopathic processes,
including the following:
Numerous other ancillary findings can be
found in myopathic muscle biopsy samples.
Additional histologic abnormalities in the
spectrum of myopathic findings include the
following:
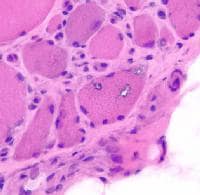
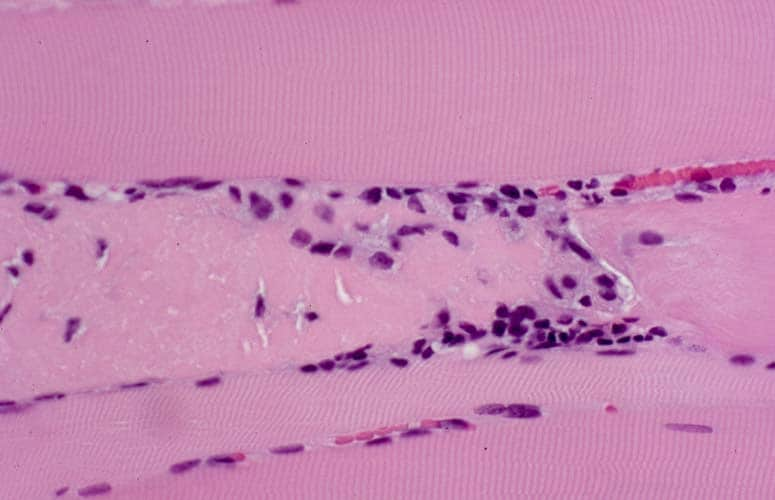
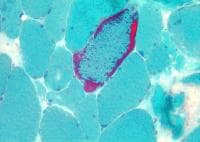
Some histologic findings mimic
abnormalities but actually are normal
features of skeletal muscle structure. For
example, near the myotendinous junction, the
muscle fibers appear fragmented, exhibit
increased variability of fiber size, and
have an increase in number of internal
nuclei (see
Media file 48). The pathologist must be
vigilant not to misjudge these findings.
Pathology of Myopathies by Diagnostic
Categories
Myositis, muscular dystrophies, glycogen
storage diseases, mitochondrial myopathies,
and congenital myopathies are 5 important
groups of disorders that can be diagnosed by
muscle biopsy.
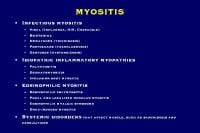
Myositis
The term myositis refers to inflammatory
disease of muscle. In practice, this term
most commonly is applied to the idiopathic
inflammatory myopathies that are the main
focus of this section; however, a
comprehensive classification of myositis
includes a variety of disorders (see
Media file 49).
The most common reason for performing a
muscle biopsy is to evaluate for the
diagnostic consideration of idiopathic
inflammatory myopathy. The idiopathic
inflammatory myopathies are polymyositis,
dermatomyositis, and IBM.
The usual clinical presentation of
patients with polymyositis and
dermatomyositis is a subacute course of
progressive weakness affecting proximal
muscle groups, occasionally with myalgia, an
elevated CK level, and myopathic and
irritative findings on EMG. Many patients
have serum autoantibodies, some of which are
associated with specific clinical syndromes.
Patients with dermatomyositis usually have
characteristic rashes. Dermatomyositis in
adults fairly often is a paraneoplastic
syndrome.
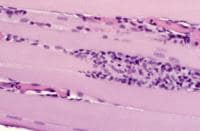
Polymyositis
The following are pathologic features of
polymyositis:
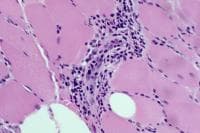
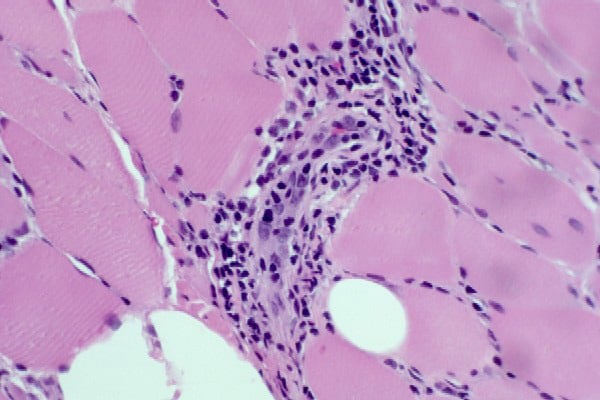
- Chronic inflammation (see
Media files 45-46): The inflammatory
infiltrates in polymyositis are
predominantly endomysial, and they are
enriched with T-suppressor/cytotoxic
(CD8) lymphocytes. The finding of
endomysial lymphoid inflammation is one
of the major diagnostic criteria for
polymyositis, but some patients are
believed to have polymyositis when
inflammation is not found on muscle
biopsy.
- Myofiber necrosis (see
Media file 47): This can be
segmental, affecting only part of a
myofiber.
- Myophagocytosis (see
Media file 32): This is the removal
of the dead cellular elements by
macrophages.
- Invasion of nonnecrotic myofibers by
autoaggressive lymphocytes (see
Media file 50): This is a key
diagnostic finding in which T cells
attack intact myofibers. This is
believed to be the pathologic correlate
of the main factor in the
etiopathogenesis of polymyositis. This
represents the fundamental distinction
between inflammation that can occur as a
secondary phenomenon and inflammation
that is the primary pathologic process.
In the former case (eg, muscular
dystrophy), inflammation is usually
found associated with fibers that are
already degenerating. In polymyositis,
inflammation can be found associated
with healthy, intact fibers.
- Internal nuclei (see
Media file 36): These are a
nonspecific myopathic finding.
- Myofiber atrophy: Atrophic fibers
generally are of both myofiber types and
rounded in contour. In some patients
with polymyositis, the atrophy affects
primarily type 2 myofibers. Type 2
myofiber atrophy can develop from
administration of steroids.
- Regeneration (see
Media file 33)
- Fibrosis: This is a feature of
chronic polymyositis.
The distribution of the pathology in
polymyositis can be patchy, so obtaining
normal biopsy findings are possible in a
patient who has this disorder and do not
exclude the diagnosis.
A subgroup of patients who are believed
to have polymyositis have an abnormal muscle
biopsy that does not show inflammation.
These patients present with a fairly rapidly
evolving myopathy with severe weakness. They
tend to have exceedingly high CK levels,
often greater than 20,000 IU/L. Some of
these patients have autoantibodies in their
serologic studies, often anti–signal
recognition particle (anti-SRP). The
presence of these autoantibodies is the
strongest evidence that this disorder is an
immune-mediated disease. In this group of
patients, the disease is resistant to
therapy. Muscle biopsy shows the presence of
scattered necrotic fibers, myophagocytosis,
and other nonspecific myopathic findings,
but inflammatory infiltration is absent.
Dermatomyositis
Pathologic findings in dermatomyositis
occasionally can bear a superficial
resemblance to polymyositis, but some
important distinguishing features are
present. In many patients, the pathology of
dermatomyositis is strikingly unique.
The following are pathologic features of
dermatomyositis:
- Chronic inflammation (see
Media file 51): The infiltrates most
often are concentrated in a perimysial
perivascular distribution. More
B-lymphocytes and T-helper (CD4)
lymphocytes are present than in
polymyositis. In the clinical
laboratory, typing the lymphocytes is
not customary.
- Myofiber necrosis
- Perifascicular atrophy (see
Media file 52): This atrophy affects
the fibers at the periphery of the
fascicle and is believed to be a product
of muscle ischemia at the capillary
level. It is found somewhat more often
in juvenile dermatomyositis, but can be
observed in the adult variant of this
disorder and is found infrequently in
other disease processes.
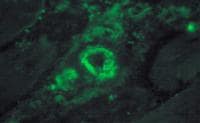
- Complement deposition in microvessel
walls (see
Media file 53): The deposition of
the membrane attack complex of
complement (C5b-9) is found in the walls
of the microvessels early in the disease
process, even before other pathologic
findings are present. This immune attack
on vessel walls, with an immunologic
cascade involving humoral immunity, may
be the pathogenetic mechanism of
dermatomyositis, according to the
research of Andrew Engel and his
colleagues. Treatment eliminates this
finding.
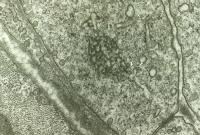
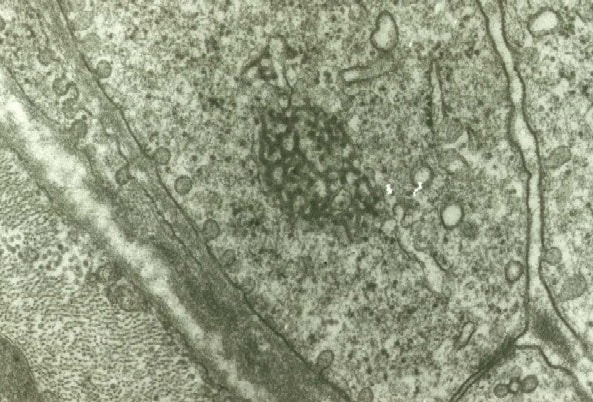
- TRIs in endothelial cells (see
Media file 54): This finding is seen
only at the ultrastructural level and no
longer is present after treatment.
Inclusion-body myositis
IBM is the most common myositis in
patients older than 50 years. In contrast to
polymyositis and dermatomyositis, which
affect more women than men, IBM most often
affects men. The clinical course of IBM may
be more indolent than the other 2 forms of
myositis, and distal muscles are involved
most often in IBM. IBM is the inflammatory
counterpart of a group of disorders labeled
inclusion body myopathy, which includes a
variety of inherited myopathies, some with
characteristic distinctive clinical
presentations (eg, quadriceps-sparing
myopathy). These myopathies share many of
the pathologic findings of IBM.
The following are pathologic features of
IBM:
- Chronic inflammation: The
inflammatory process is similar to that
of polymyositis.
- Invasion of nonnecrotic myofibers by
autoaggressive lymphocytes (see
Media file 55)
- Hypertrophy (see
Media file 56): Hypertrophy in a
myositis should prompt a consideration
of the possibility of IBM.
- Atrophy: On occasion, the atrophic
fibers in IBM share features with those
of neurogenic atrophy.
- Rimmed vacuoles (see
Media file 57): These appear on H-E
as ovoid sarcoplasmic vacuoles lined by
blue granular material. On trichrome
stains, the granular material is red.
- Eosinophilic inclusions (see
Media file 58-59): These inclusions
are dense and red on H-E, they may be
cytoplasmic or nuclear, and they may be
found in rimmed vacuoles. They stain
positive with stains for beta-amyloid
precursor protein, ubiquitin, and other
proteins associated with
neurodegenerative disease.
- Tubulofilamentous inclusions (see
Media file 60): These are the
ultrastructural counterparts to the
eosinophilic inclusions observed by
light microscopy.
- Myofiber degeneration,
myophagocytosis, internal nuclei,
fibrosis (see
Media files 56-57)
An occasional eosinophil often can be
seen in necrotizing and inflammatory
myopathies. When many eosinophils are
present, begin to search for a specific
etiology of the myopathy, such as
trichinosis (see
Media file 61) or drug reaction (see
Media file 62).
Muscular dystrophies
Muscular dystrophy is a hereditary
disease characterized by progressive
degeneration of muscle. Many such diseases
exist. The old classification scheme
comprised Duchenne, Becker, various other
eponymous dystrophies, and a group of
dystrophies named for the distribution of
affected muscle groups or by their mode of
inheritance. As researchers determine the
etiology of many of these disorders, a more
pathogenetic nomenclature is evolving.
Duchenne and Becker dystrophies now are
classified as dystrophinopathies because
they are caused by mutations in the gene for
the protein dystrophin. Similarly,
abnormalities of other structural proteins
of skeletal muscle are being discovered, so
that now, instead of limb-girdle muscular
dystrophy, disorders due to abnormalities of
membrane proteins, such as sarcoglycans,
dystroglycans, dysferlin and others, are
recognized. Abnormalities of proteins of the
external basal lamina and cytoskeletal
proteins are also responsible for some forms
of muscular dystrophy.
As steady progress is made in determining
the genetic basis of many muscular
dystrophies, muscle biopsy will become less
important as a diagnostic tool for these
disorders. Muscle biopsy is still required
for most muscular dystrophies, except for
approximately two thirds of patients with
Duchenne and Becker muscular dystrophies in
which the diagnosis can be made by genetic
testing of blood samples and a few
additional rare forms of muscular dystrophy.
Most of the pathologic findings in the
routine histologic sections of skeletal
muscle in the muscular dystrophies are
nonspecific myopathic findings (see
Media files 31-39). Occasional features
are characteristic of certain dystrophies,
such as hypercontracted fibers in Duchenne
muscular dystrophy (DMD) (see
Duchenne muscular dystrophy) or nuclear
clumps in some patients with limb-girdle
dystrophy. The skeletal muscles of some
patients with oculopharyngeal dystrophy (see
Media file 44) contain rimmed vacuoles
and eosinophilic inclusions.
The specific diagnosis of muscular
dystrophies can be confirmed in many
patients with special immunohistochemical
stains for specific proteins that are
abnormal or deficient in these disorders.
Many of these disorders are uncommon, so it
is necessary to send the muscle biopsy to a
laboratory that is prepared to perform these
studies if they are indicated. If the
immunohistochemistry results point to a
certain disorder, the muscle specimen must
then be sent to a laboratory that can
perform biochemical analysis of the protein
for confirmation of the immunohistochemistry
and definitive diagnosis.
Immunohistochemistry is not useful as a
diagnostic tool for some of the uncommon
muscular dystrophies, for reasons that are
beyond the scope of this article.
When the clinical suspicion of the
presence of a muscular dystrophy is strong,
make arrangements to obtain a specimen of
muscle appropriate for biochemical analysis.
Please see
Optional additional fresh specimen for
details on how to proceed.
Examples of muscle biopsies from patients
with Duchenne or Becker muscular
dystrophies, the dystrophinopathies, or
congenital muscular dystrophy (CMD) are used
to illustrate the pathology of muscular
dystrophies.
Duchenne muscular dystrophy
DMD is the most common and most severe of
all muscular dystrophies, occurring with a
frequency of 1 case in 3500 live male
births. It is caused by a mutation on the X
chromosome in the gene for the structural
protein dystrophin, resulting in an absence
of the protein. The gene for dystrophin is
large, with 2 million base pairs. Because of
the size of this gene, mutations are common,
and one third of patients with DMD do not
have a family history of the disease. The
children are generally healthy until
approximately age 3 years, when they develop
problems with gait, and from then on
experience an inexorably progressive course.
Without treatment, all patients are
wheelchair bound by 12 years, and most die
in the second decade. With steroid therapy,
many patients remain ambulatory until the
age 15 or 16 years, and survival is
prolonged well into the third decade.
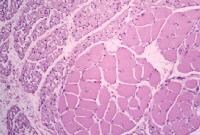
Muscle biopsy sections from young
patients with DMD illustrate the
characteristic pathologic findings:
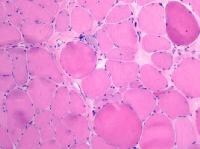
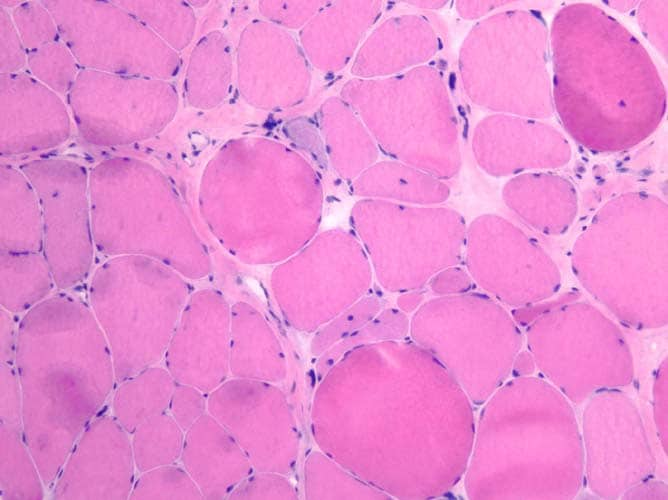
- Fibrosis (see
Media file 63)
- Increased variability of fiber size
caused by the presence of both atrophy
and hypertrophy (see
Media file 63) with fiber splitting
(see
Media file 64)
- Myofiber necrosis (see
Media file 65)
- Increased internal nuclei
- Opaque fibers (see
Media file 66): These are
characteristic of DMD, though they can
be found in other disorders. Opaque
fibers are enlarged, densely
eosinophilic fibers that are
hypercontracted. Their presence in DMD
led investigators to postulate that
membrane defects may be present in DMD,
which were later demonstrated. In DMD,
the lack of dystrophin leads to membrane
instability, which is responsible for
the cascade of cellular events that
causes cycles of necrosis, regeneration,
and progressive fibrosis of the muscle.
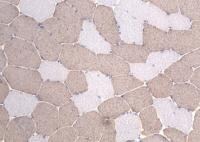
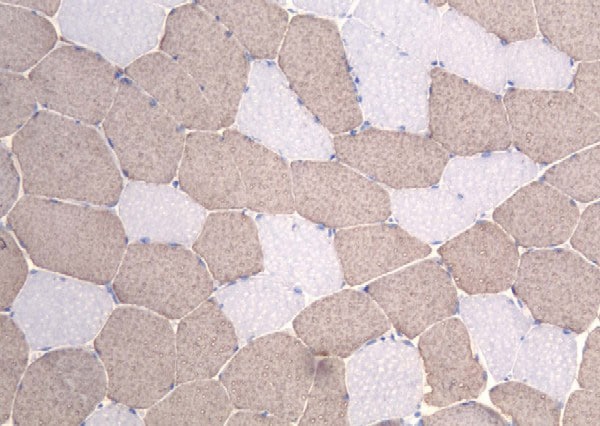
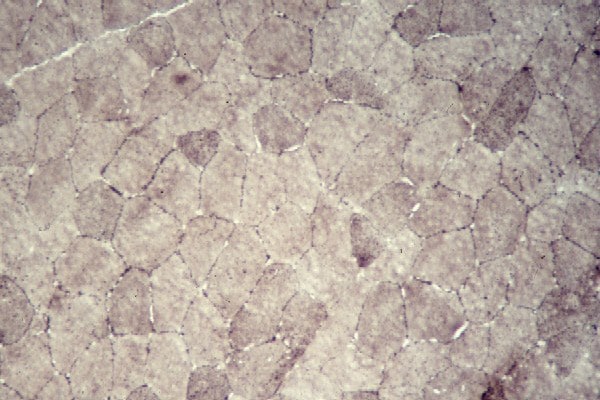
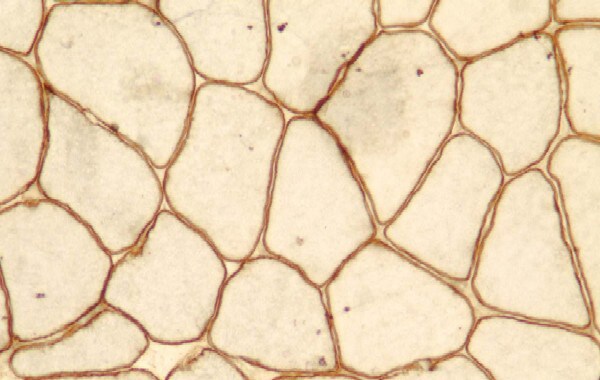
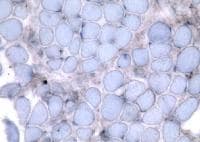
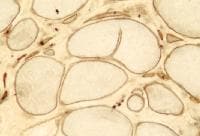
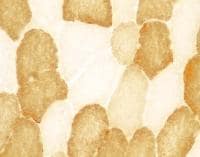
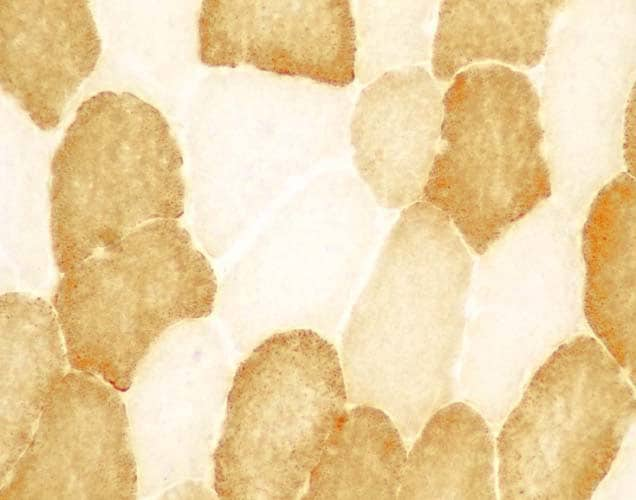
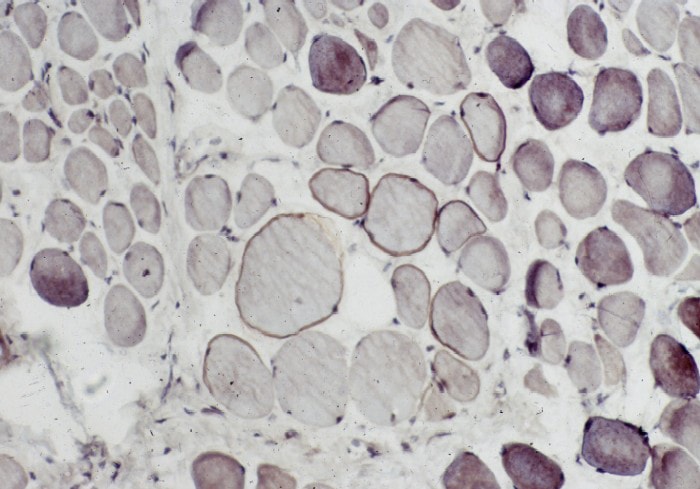
Special immunohistochemical studies for
N -terminal, mid-rod, and C
-terminal moieties of the dystrophin
molecule can be performed. In control
skeletal muscle, these studies reveal linear
staining of the periphery of the myofibers,
consistent with the periodic subsarcolemmal
localization of dystrophin (see
Media file 67). In a patient with DMD
(see
Media file 68), all 3 antibodies
demonstrate absence of staining in all but
an occasional fiber. The rare fibers that
stain with antidystrophin antibody actually
can produce dystrophin because of a second
mutation in the dystrophin gene that
restores the reading frame and allows for
production of this protein. The observation
that occasional fibers in patients with DMD
can produce dystrophin serves as the basis
for the current efforts to develop novel
therapeutic interventions for this disorder.
Becker muscular dystrophy
Becker muscular dystrophy (BMD), a
disease similar to DMD but with a later
onset and a course characterized by a slower
progression, is also caused by mutations of
the dystrophin gene. In BMD, the mutations
lead to production of abnormal dystrophin,
occasionally in decreased quantities in
comparison with normal skeletal muscle and
in contrast to the absence of dystrophin of
DMD.
The course of BMD is more variable than
that of DMD, which is fairly stereotypical.
In BMD, the severity of the disease is
correlated with the portion of the
dystrophin molecule affected. The C
-terminal end of dystrophin is linked to a
beta-dystroglycan of the transmembrane
glycoprotein complex that in turn is linked
to the external basal lamina of the
myofiber. If this region of the dystrophin
molecule is absent, the patient experiences
a severe course. In general, if the patient
has a mutation affecting the mid-rod domain
or a mutation affecting the N
-terminal end of the dystrophin molecule,
which is linked to cytoskeletal actin, the
course is more indolent.
The muscle biopsy illustrating BMD in
this article, below, is from a 22-year-old
man with a history of gradually progressive
weakness that began in early childhood. At
the age of 22 years, he remained ambulatory
but could no longer run. Biopsy demonstrated
the following:
- Myofiber necrosis (see
Media file 69): Mild, focal, chronic
inflammation is associated with some
necrotic fibers in this biopsy.
Inflammation occasionally leads to a
mistaken consideration of an
inflammatory myopathy. In the patient
above, his clinical history strongly
suggested dystrophy instead of
inflammatory myopathy, which should
prompt a pathologist to avoid hastily
forming an erroneous conclusion. With
dystrophy, the inflammation is often
restricted to an association with
necrotic fibers, whereas in myositis, it
can be found elsewhere in the muscle;
this key finding can sometimes help to
distinguish the inflammation in a
dystrophy from that of myositis. This
assessment can be difficult, and
exceptions to this guideline exist. In
some cases, the clinical history, rather
than the histology alone, prompts the
additional search for a dystrophy.
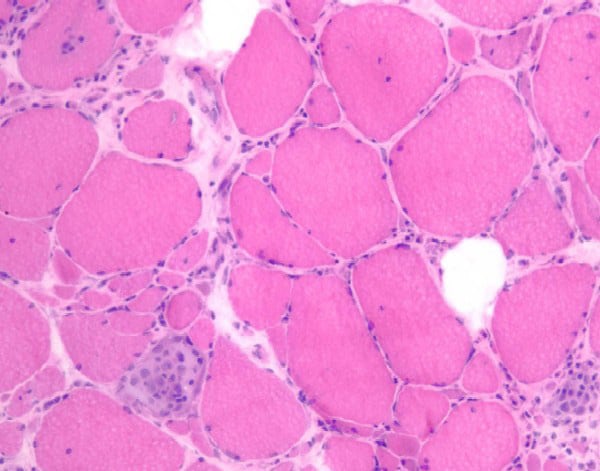
- Increased variability of fiber size
with atrophy and hypertrophy (see
Media file 70) and fiber splitting
(see
Media file 71)
- Myofiber regeneration (not shown)
- Increase in internal nuclei (see
Media file 70-71): In this patient,
the increase in the percentage of fibers
with internal nuclei is slight.
The findings in this representative
biopsy can be observed in most muscular
dystrophies. The immunohistochemical
findings lend specificity to the histologic
diagnosis. In this situation, staining for
C -terminal and mid-rod portions of
the dystrophin molecule is normal (see
Media file 72), but the muscle shows no
staining with the antibody for the N
-terminal region (see
Media file 73). This is highly
consistent with the diagnosis of BMD, but
confirming this diagnosis by sending a
skeletal muscle specimen to a laboratory for
Western blot analysis is appropriate.
In the situation illustrated here, muscle
biopsy was not performed at a facility that
could appropriately handle it for such an
analysis. However, such strong correlation
was present between the patient's clinical
course, the findings on routine muscle
biopsy, and the immunohistochemical findings
that the correct diagnosis was not in doubt.
Extensive research has led to a detailed
model of the structure of the myofiber
membrane and has revealed many of the
components of the transmembrane glycoprotein
complex. It contains several proteins known
as sarcoglycans and others termed
dystroglycans. Mutations of each of these
proteins, as well as others not mentioned
here, now are known to be responsible for
many forms of muscular dystrophy.
Congenital muscular dystrophy
CMD is clinically evident from the
neonatal period. Multiple disorders probably
fall within this category. In one third of
patients, CMD is caused by an abnormality of
laminin alpha-2, also known as merosin,
which is a component of the basal lamina of
skeletal muscle.
Muscle biopsy was performed in a
4-month-old floppy boy who was a full-term
infant with low Apgar scores. He had mild
joint contractures and weakness of upper
extremities greater than that of lower
extremities. Electrodiagnostic studies
showed early myopathic units and borderline
nerve conduction velocities. CT scans and
MRIs of the brain were normal.
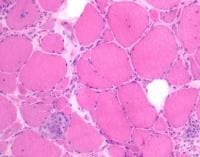
Biopsy (see
Media file 74-76) showed a range of
fiber sizes, instead of the normal uniform
size of myofibers. No necrosis was present,
but occasional fibers with minor
abnormalities on trichrome and NADH stains
were slightly suggestive of a mitochondrial
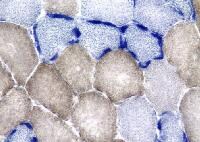
disorder. Immunohistochemical findings for
dystrophin were normal (see
Media file 74), but no staining occurred
with an antibody to laminin alpha-2 (see
Media file 75). A control stain with a
normal muscle sample (see
Media file 76) demonstrated the normal
pattern of staining for laminin alpha-2.
Therefore, the most likely diagnosis was CMD
caused by deficiency of laminin alpha-2 (or
merosin).
A major clinical differential diagnostic
consideration in this patient was
Werdnig-Hoffmann disease, which is infantile
spinal muscular atrophy, a motor neuron
disease. At present, the best way to
diagnose infantile spinal muscular atrophy
is by genetic testing performed with a
sample of blood. If the blood test is
unrevealing, muscle biopsy can be performed.
In Werdnig-Hoffmann disease, as in CMD,
muscle biopsy demonstrates a range of
myofiber sizes. In Werdnig-Hoffmann disease
unlike CMD, the largest fibers (see
Media file 77) tend to cluster. In
biopsy samples from patients with
Werdnig-Hoffmann, the largest and smallest
fibers are type 1 myofibers (see
Media file 78); this finding does not
occur in CMD. An important caveat is that
these changes in myofiber distribution are
generally not present until the infant is
several months old. Therefore, when
possible, defer biopsy as long as possible,
or prepare the family for the possibility of
repeat biopsy if findings on the first are
not specifically diagnostic.
Glycogen storage disease
Glycogenoses are inherited inborn errors
of glycogen metabolism. Nine of them affect
skeletal muscle. The two most commonly
encountered by muscle pathologists are type
II glycogenosis (acid maltase or alpha
glucosidase deficiency) and type V
glycogenosis (myophosphorylase deficiency).
Type II glycogenosis
Type II glycogenosis, which is due to
deficiency of acid maltase (acid
alpha-glucosidase), has the following 3
basic clinical variants:
- A severe, fatal, infantile form,
also known as Pompe disease, affects
multiple organs, including heart, liver,
kidneys, leukocytes, central nervous
system, and skeletal muscle. Glycogen
storage is demonstrated in most tissues
in this disorder.
- A juvenile variant presents with
weakness affecting muscles of proximal
limbs.
- In adult-onset acid maltase
deficiency, weakness and fatigue occur
with progressive respiratory failure.
The age of onset and severity of the
clinical presentation are generally
correlated with the severity of the
enzymatic deficiency.
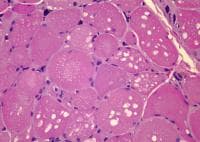
The following are muscle biopsy findings
in acid maltase deficiency:
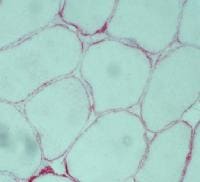
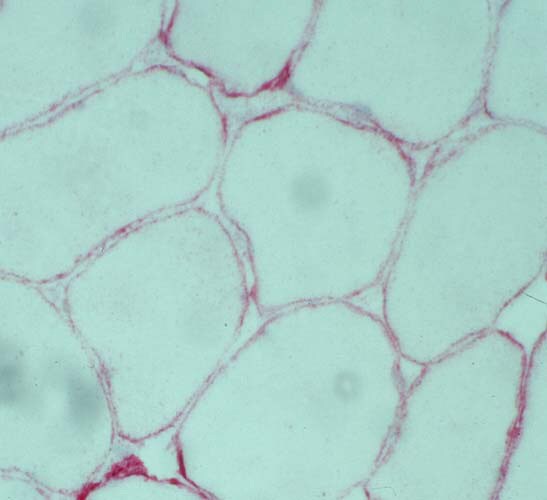
- Clear vacuoles on H-E sections,
usually distributed throughout the
muscle cell (see
Media file 79)
- PAS-positive staining of these
vacuoles, with disappearance of staining
following digestion with diastase
- Intralysosomal storage of glycogen
on EM (see
Media file 80)
Confirming the diagnosis by biochemical
assay of the activity of acid maltase from a
special sample of skeletal muscle that has
been obtained appropriately for this purpose
is best; this is the optional additional
fresh specimen described in the technical
section. The assay can also be performed on
fibroblasts or urine. It is also possible to
identify the specific mutations responsible
for the producing the disease in an
individual.
Type V glycogenosis
In Type V glycogenosis, also known as
McArdle disease, due to deficiency of
myophosphorylase, the abnormality is
restricted to skeletal muscle. The classic
presentation is the development of muscle
cramps with exercise and episodes of
exercise-induced rhabdomyolysis. Venous
lactate levels fail to rise during an
ischemic exercise test.
The following are muscle biopsy findings
in patients with myophosphorylase
deficiency:
- Clear vacuoles on H-E section,
especially in the subsarcolemmal
location (see
Media file 81)
- PAS-positive staining of these
vacuoles (see
Media file 82), with disappearance
following digestion with diastase (see
Media file 83)
- Storage of excessive amounts of free
glycogen within myofibers on EM (see
Media file 84)
- Evidence of absence of
myophosphorylase activity (see
Media file 85) on special
histochemical staining, with normal
activity in a simultaneous control
specimen (see
Media file 86)
Mitochondrial myopathies
Mitochondrial myopathies are disorders
with a broad spectrum of clinical
presentations. Numerous well-recognized
clinical disorders are among this group of
diseases (eg, Kearns-Sayre syndrome,
myoclonus epilepsy with ragged red fibers
(RRFs), mitochondrial encephalomyopathy with
lactic acidosis and strokelike episodes,
Leber hereditary optic neuropathy). Many of
these disorders present with a combination
of central nervous system disease and
myopathy and are referred to as
encephalomyopathies. The common etiology
underlying these disorders is the presence
of a mutation that affects mitochondrial
function. In some of these disorders, the
mutations are in the mitochondrial genome;
in others, they are in the nuclear genes
that encode mitochondrial proteins.
Many of these fairly diverse disorders
share a common finding on muscle biopsy, the
RRF. Genetic elucidation of these disorders
has revealed that the RRF is not found in
all of these disorders. Nonetheless, it is
helpful when present on muscle biopsy.
The following are characteristic
pathologic findings in skeletal muscle in
the mitochondrial myopathies:
- On trichrome stain, RRFs have a
peripheral rim of red material caused by
the subsarcolemmal aggregation of
mitochondria (see
Media file 87).
- Dense peripheral staining for the
activity of SDH, which is a
mitochondrial enzyme involved in the
tricarboxylic acid cycle, can be seen in
RRFs (see
Media file 88).
- The presence of many fibers negative
for the activity of COX, which is
complex IV of the respiratory chain
enzymes, is a characteristic finding
(see
Media file 88).
- Combined SDH/COX staining
demonstrates that the RRFs are the
COX-negative fibers (see
Media file 89).
- EM shows both an increase in
mitochondria and morphologically
abnormal mitochondria (see
Media files 90-92).
Identifying the specific biochemical and
genetic abnormalities is possible in many
patients with mitochondrial
encephalomyopathies if an extra muscle
specimen has been properly handled for this
purpose.
Congenital myopathies and tubular
aggregate myopathy
Congenital myopathies form a diverse
group of disorders with the common feature
of distinctive pathologic findings. Each
congenital myopathy is named for these
findings, as in the following:
- In central core disease, the central
region of many myofibers has abnormal
structure.
- In nemaline myopathy, the fibers
contain aggregates of rodlike material
seen on trichrome stain.
- In centronuclear (or myotubular)
myopathy, the main pathologic finding is
fibers with centrally located nuclei and
fibers that appear immature.
Each congenital myopathy may be a group
of disorders with a common morphology. Some
have multiple characteristic clinical
presentations, rates of progression, and
modes of inheritance. Currently, the genetic
and molecular bases of the defects are being
identified, providing further evidence that
they are heterogeneous disorders.
Nemaline myopathy
Nemaline myopathy is a disease with both
autosomal dominant and recessive modes of
inheritance. A severe infantile form exists,
and milder forms present later in life.
Evidence exists in some patients for
abnormalities of the alpha tropomyosin gene,
alpha actin gene, and nebulin gene. A form
of nemaline myopathy is associated with HIV
infection.
The biopsy shown here, from an 8-year-old
boy who always had difficulty keeping up
with his peers on the playground,
demonstrates the characteristic findings of
nemaline myopathy:
- H-E stain (see
Media file 93) reveals a biopsy that
appears normal except for a slight
increase in internal nuclei.
- Trichrome stain (see
Media file 94) shows the presence of
inclusions in many fibers; on high power
(see
Media file 95), these have a rodlike
structure.
- Myosin ATPase (see
Media file 96) shows a predominance
of type 1 myofibers.
- EM (see
Media file 97) shows that the rods
are dense fibrillar structures that
extend from the Z bands.
Central core disease
Central core disease is another disorder
that is actually a group of disorders. Many
patients with central core disease are
susceptible to malignant hyperthermia when
certain anesthetics are administered. Some
patients with central core disease possess
mutations in a gene for the ryanodine
receptor, which is a calcium channel in the
sarcoplasmic reticulum.
In central core disease, an H-E section
(see
Media file 98) shows many myofibers with
faint central abnormalities. Myosin ATPase
(see
Media file 99) demonstrates that many of
the type 1 myofibers have central round
areas that do not stain. These are the
central cores. They also show absence of
staining with the NADH stain, not
illustrated here.
Tubular aggregate myopathy
Tubular aggregate myopathy is a rare
disorder that is not usually classified as a
congenital myopathy, but it has such a
distinctive histopathologic picture that it
is presented in this section. In a rare
familial syndrome, affected patients have
fluctuating weakness. Tubular aggregates
also are found in association with muscle
cramps, diabetes mellitus, and alcoholism.
In tubular aggregate myopathy, inclusions
are quite prominent, as demonstrated in the
following:
- H-E (see
Media file 43): Many fibers have
large, pale intracytoplasmic inclusions.
- PAS (see
Media file 100): These inclusions
are PAS positive.
- Fiber-typing stain (see
Media file 101), in this case myosin
ATPase: In this myopathy, inclusions
usually are found only in type 2
myofibers, as illustrated here. This is
highly unusual. In most disorders with
inclusions that are fiber-type specific,
the inclusions usually are found in type
1 myofibers.
- NADH (see
Media file 102): Inclusions are dark
with this stain.
- SDH (see
Media file 103): Tubular aggregate
myopathy is the rare disorder in which
inclusions are positive with the NADH
stain but are negative for SDH. They are
negative for the latter stain because
the tubular aggregates are composed of
sarcoplasmic reticulum membrane. SDH is
found exclusively in mitochondria.
- EM of tubular aggregates in cross
section (see
Media file 104): Their tubular
structure is appreciated easily in this
view.
- EM of tubular aggregates in slightly
tangential longitudinal section (see
Media file 105): This image
demonstrates continuity of the tubules
with the lateral sacs of the
sarcoplasmic reticulum.
Conclusion
Muscle biopsy is a diagnostic tool of
great potential in the diagnosis of
neuromuscular disease. When performed
properly, it can yield information of great
benefit to the patient and clinician and
serve as a basis for providing treatment,
genetic counseling, and prognostic
information.
This article serves as a primer on the
technical aspects of muscle biopsy, which
are critical for the success of this
procedure. Clinical features of
neuromuscular disease are highlighted
because the history is crucial for the
correct interpretation of the histologic
findings in a sample of skeletal muscle.
The presentation of the structure and
histology of normal muscle serves as a basis
for comparison with the pathologic
alterations observed in muscle. Finally, the
general introduction to pathology of
selected categories of disease of skeletal
muscle is intended to provide a basis for
understanding the pathophysiology of some of
these disorders and to assist the reader in
visualizing the effect of disease and to
demonstrate the formulation of
histopathologic diagnoses.
Multimedia